Zoom
Trash

50 amazing new infographics added to our gallery. Indeed, in the past couple of months we’ve seen a lot of infographics and data visualizations added to our gallery.
And just a few weeks ago, we crossed the 3.000 infographic milestone, which is something we’re really proud of, since we’re basically talking about some of the best designers and graphic desks in the world. So, for this special round up dedicated to visual journalism, we selected no less than 50 amazing infographics, covering all types of events and news – you won’t see much of the Olympics, though, since we’ll dedicate another post just for the works published about Rio 2016.
Infographics Templates Archives - Page 2 of 6. New Library Infographics: 1930′s style. Library Infographics: 1930′s style Nowadays, the visualization of data is all the rage.
It seems each new study or piece of research is turned into an image. I’m not so sure this was as common in the 1930’s and 40’s when these visual aids were printed. The series of 28 posters were produced under the supervision of noted librarian Ruby Ethel Cundiff for the Library School Course in Teaching the Use of the Library at the George Peabody College for Teachers.
NerdGraph - The best infographics blog of the galaxy! Cool Information Design & Information Graphics. Infographaholic. 20 Animated And Interactive Infographics You Have To See. The 83 best infographics. Every picture tells a story, as they say, but sometimes it takes a clever combination of words and pictures to tell a story quickly, concisely and in an entertaining fashion. The best infographics may look like they were simple to create in Photoshop, but designing an effective piece of data visualization is usually anything but. There are several great tools to create infographics, but these examples of infographics from around the web will show you how you can take it a step further and add a bit of style and personality to your data. Some are older than others, but they can still provide some inspiration for those of you looking to create an infographic from scratch.
Some are funny, some more serious, and all are inspiring examples of the art. If Star Wars: The Last Jedi has put you in the mood to immediately watch the original movie, hold your horses just one second. 02. 03. Search Results infographics. Math infographic Archives. 11 Infographics About Infographics. Drew Skau published on February 18, 2013 in Design.
50 Informative and Well-Designed Infographics - Hongkiat. It’s impossible to comprehend complex data or analyze large amounts of information, if we only use words or texts.
Information graphics or better known as infographics are visual explanation of data, information or knowledge. These graphics are excellent visual tools for explaining huge amounts of information where complex data needs to be explained immediately and clearly. Let me show you how Rick Mans explain how infographics ease the process of communicating conceptual information Image credit. Infographic is one of the most challenging types of graphic design because the creation process alone is pretty intensive. Understanding Close Reading - Infographic. Science Infographics. Infographics, The Human Body and Crime Scenes. World Cup InfoPosters worth seeing.
The 2014 World Cup has been well-covered here on Visual Loop, bringing you the latest visualizations, interactive maps and print infographics that are published as the competition progresses.
Our World Cup Pinterest board, now with more than 200 examples of visual journalism from newspapers and magazines, will surely keep on growing during the next weeks, with such a prolific production. But, naturally, a passionate topic such as this – we’re talking about the most popular sports in the world, after all – draws the attention from other creatives and publishers. Yes, we’re including here “those” types of infoposters, but also special projects that, despite being outside the journalistic sphere, are as impressive and visual appealing as they can be. Hope you enjoy this quick round up with static infographics and infoposters, and as always, feel free to send over other interesting visualization projects about the 2014 World Cup.
(Via) Sports Infographics. Music Infographics - NerdGraph Infographics. You Brain on Music We here at Snapverse are huge believers in the power of music.
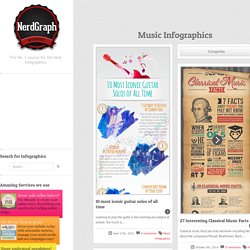
In fact, we… Michael Jackson Check it this infographic for facts about pop music sensation Michael Jackson. This Is Your Brain On Music [Infographic] We know music can profoundly affect us, whether you're the type who gets weepy at a classical performance or kicks a child at a metal show.
![This Is Your Brain On Music [Infographic]](http://cdn.pearltrees.com/s/pic/th/infographic-popular-science-50833140)
But what exactly is going on in our brains when that happens? This cartoony infographic from the University of Florida breaks it down, from the ear to the brain. It also includes some interesting notes about the correlation between brainwaves and emotions. Low beta waves, for example, are associated with concentration and alertness, while alpha waves are associated with relaxation and daydreams. But maybe take some of this stuff with a grain of salt: Taking a class on music education isn't necessarily going to improve your SAT scores, even if picking up the trombone is correlated with bubbling in the right answers.
The Psychology of Music infographic. Mood & Music. Musical preference is unique to the listener.
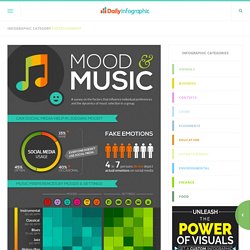
There are so many different cultures and personalities–which makes it quite difficult to decide what to listen to. In addition to different tastes in music, there are times and places where it may not be appropriate to play something. A scene at the airport would be hard to imagine if one was able to hear hit rap songs over the PA system. A company like Toys’R’Us would not play rock music for their customers. Personally, some kind of rock is preferred. According to the infographic, more people listen to rock music when they are upset. Classical music - the infographics. What's the right orchestral instrument for you?
Want to take up a musical instrument but don't know which one? Scared that the instrument you've chosen - and have been spending all those hours practising - is not the right one for you? Our friends at CBC music have produced this very elegant (and very helpful) flowchart. Give it a go and tell us what you got. Click for a closer look: Music and the brain What does listening to music actually do to you? 100 Years of Rock Visualized. Global Internet Usage By the Numbers. A Visual History of Google Algorithm Updates [Infographic] In the early days, Google's search engine wasn't nearly as powerful or accurate as it is today.
![A Visual History of Google Algorithm Updates [Infographic]](http://cdn.pearltrees.com/s/pic/th/history-algorithm-updates-77577984)
I'm talking back in the late 90s and early 00s, when search engines were little more than keyword-matching and link-counting machines. Ranking highly in search results could be accomplished by essentially using a simple, two-step procedure: Step 1: Stuff your keyword phrase into your website as many times as possible.Step 2: Get as many gosh-darn inbound links as you possibly could.
For those early "SEO gurus" who gamed the system -- achieving high rankings while adding little value for actual searchers -- the fun wouldn't last. Every time Google found a weakness in its ability to deliver relevant, high-quality search results, they made fixes to address it. One of the more recent Google search algorithm "fixes" was a mobile-friendly update, which put more emphasis on a website's mobile-friendliness as a ranking factor for searches from a mobile device.
Share This Image on Your Site. Music Infographics. 9 Best Animated Infographics on the Web. Bringing infographics to life using animation is still on the cutting edge, but this trend is set to continue throughout 2015. Coupling animation with engaging ideas can send the infographic into the viral stratosphere – these awesome infographics have been featured on the biggest sites on the web. 1. How to Build a Human A designer who has really taken the gif-infographic format to new heights is Eleanor Lutz.
Credit. Elearning Infographics - Awesome Lists. Which Flight Will Get You There Fastest? Animated infographics. Infographics for young kids. Infographic, Infographics and Data Visualization. What are your sleeping habits? Daily Infographic. 11 Infographics About Infographics.