
Visualizing Our Understanding: Graphic Organizers - TechNotes Blog - TCEA. “The use of graphic organizers,” says the El Campo ISD’s Intervention Warehouse website, “is a powerful tool that is easy to integrate into daily instruction.”
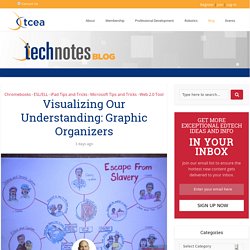
The ECISD site then goes on to share access to several sources for graphic organizers for visualizing learning. Graphic organizers are teaching and learning tools; when they’re integrated into classroom experiences, students are better able to understand new material. Creating a strong visual picture, graphic organizers support students by enabling them to literally see connections and relationships between facts, information, and terms.Source: Teaching Graphic Organizers As a writer, I often skipped “outlining” and note-taking as ways to organize my writing and notes. Instead, I created graphic organizers to capture ideas and map out my writing. The Problem with Graphic Organizers Imagine that when someone says to you, “Could you read this technical text and summarize it?” Instead, you would just use the right one for each task.
Vizzbuzz. Quote Generator - Make Your Own Unique Quote - Behappy.me. Quozio - Make Beautiful Quotes. Recite.com - Create beautiful visual quotes as images. Quote Makers, Engage! - TechNotes Blog - TCEA. Leaders, looking for an easy app to use to spice up important quotes that you include in your staff missives, parent newsletters, or student projects?
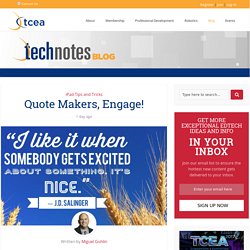
How about a simple way to highlight key ideas in assigned student text? Typorama may fit the bill for iOS device users! Quote Makers, Create! I love collecting quotes, often snapping a photo of my favorite quotes at Buc-ee’s while I’m traveling or jotting them down in my handy notepad. The best part of being out on the road is encountering truisms, as well as listening to K-12 and adult learners share their stories. Just last month, I spent some time in Edinburg facilitating Microsoft Innovative Educator (MIE) professional learning. Don’t you think this is more engaging than words on a slide? Scan this image with Aurasma to listen to the audio introduction from Dr. Quote Makers, Adhere to Copyright! Note: Don’t have an iOS device? Not satisfied with the pictures that come with Typorama? Learning Connections a work of art. Make Your Images Interactive - ThingLink. Tools and Resources for Remarkable Explanations.
Sometimes, words are not enough.
To grab an audience’s attention and make an explanation remarkable, explainers need ways to stand-out, to be interesting. Thankfully there are a growing number of resources that can help explainers turn their ideas into experiences that captivate audiences. I've listed a few below. (Note: I am not affiliated with the services below and receive no compensation from them). While you're thinking about these resources, consider this... Dan Roam is known for a series of books that focus on the use of simple drawings to understand and solve problems. Nancy Duarte and her company, Duarte Design, is known around the world for designing amazing and effective presentations.
26+ Ways to Use Thinglink in the Classroom. 30+ Really Useful Infographics Tools & Resources. Infographic credit: Ivan Cash Infographics are everywhere! Whether you’re a fan of them or not , infographics have become a staple of web content and are engaged in a seemingly endless love affair with social media. As digital marketers, we’re interested in the content marketing potential of infographics, which can generate thousands of pageviews, social media shares, backlinks and capture mindshare. If you’re interested in developing your own infographics to reap these potential benefits, we put together this list of 30+ useful infographic tools and resources to help you on your way.
We included a well-rounded mix of charts & graphs generators, graphics programs, mind-mapping tools, and resources for finding data sets and statistics. Whether you’re just looking for simple online charting tools or seeking complex data visualization software, the list below has got you covered! (Listed below in Alphabetical order!) Comments(12) GraphicSprings.com - Free Online Logo Design Tool to Create and Make Professional Logos. A new way to learn. CoSketch.com - Online Whiteboard Collaboration.
Brainstorm and mind map online. Cacoo - Create diagrams online Real time collaboration. Tagxedo - Word Cloud with Styles. Many Eyes. An OOPS and Teague Graphic Organizer Page! Cool Infographics - Blog. Infographics & Data Visualizations. Smore - Design beautiful online flyers and publish instantly.
Online Diagram Software and Flowchart Software - Gliffy. Google SketchUp. Draw Diagrams Online using Collaborative Diagram Tools.