
Tutorials · mbostock/d3 Wiki. Wiki ▸ Tutorials Please feel free to add links to your work!!
Tutorials may not be up-to-date with the latest version 4.0 of D3; consider reading them alongside the latest release notes, the 4.0 summary, and the 4.0 changes. Introductions & Core Concepts Specific Techniques D3 v4 Blogs Books Courses D3.js in Motion (Video Course)Curran Kelleher, Manning Publications, September 2017D3 4.x: Mastering Data Visualization Nick Zhu & Matt Dionis, Packt. Talks and Videos Meetups Research Papers D3: Data-Driven DocumentsMichael Bostock, Vadim Ogievetsky, Jeffrey HeerIEEE Trans. Diagramming Components for HTML5/Canvas, by Northwoods Software® GoJS is a feature-rich JavaScript library for implementing interactive diagrams across modern web browsers and platforms.
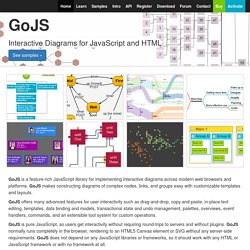
GoJS makes constructing diagrams of complex nodes, links, and groups easy with customizable templates and layouts. GoJS offers many advanced features for user interactivity such as drag-and-drop, copy-and-paste, in-place text editing, templates, data binding and models, transactional state and undo management, palettes, overviews, event handlers, commands, and an extensible tool system for custom operations. GoJS is pure JavaScript, so users get interactivity without requiring round-trips to servers and without plugins. GoJS normally runs completely in the browser, rendering to an HTML5 Canvas element or SVG without any server-side requirements.
GoJS does not depend on any JavaScript libraries or frameworks, so it should work with any HTML or JavaScript framework or with no framework at all. When upgrading to a newer version, please read the Change Log. In the Garden - Exploring the possibility of Graph Layouts in JavaFX. Exploring the possibility of Graph Layouts in JavaFX Tim joined us this fall for an undergraduate research appointment.
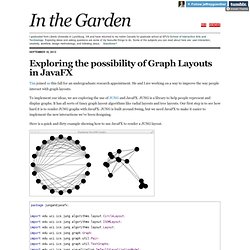
He and I are working on a way to improve the way people interact with graph layouts. To implement our ideas, we are exploring the use of JUNG and JavaFX. JUNG is a library to help people represent and display graphs. Perception. Graph. Graph Description In mathematics and computer science, graph theory studies networks of connected nodes and their properties.

A graph can be used to visualize related data, or to find the shortest path from one node to another node for example. Central concepts in graph theory are: Node: a block of information in the network.Edge: a connection between two nodes (can have a direction and a weight).Centrality: determining the relative importance of a node.Clustering: partitioning nodes into groups. The NodeBox Graph library includes algorithms from NetworkX for betweenness centrality and eigenvector centrality, Connelly Barnes' implementation of Dijksta shortest paths (here) and the spring layout for JavaScript by Aslak Hellesoy and Dave Hoover (here).
For those of you looking for the old Graph library built on Boost, it can still be found here. Download Documentation The library has a cool example of a visual browser for WordNet. How to get the library up and running. Raph Visualization – Unpicking the Hairball - Joe Parry @ GraphConn... Automatic Insight Discovery. Tim Dwyer - Google Scholar Citations. Large-scale RDF Graph Visualization Tools. AI3 Assembles 26 Candidate Tools The pending UMBEL subject concept “backbone” ontology will involve literally thousands of concepts.
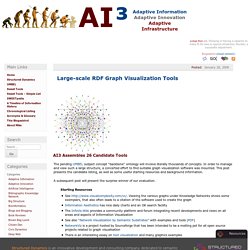
In order to manage and view such a large structure, a concerted effort to find suitable graph visualization software was mounted. This post presents the candidate listing, as well as some useful starting resources and background information. A subsequent post will present the surprise winner of our evaluation. Starting Resources Various Example Visualizations For grins, you may also like to see various example visualizations, most with a large-graph bent: Software Options Here is the listing of 26 candidate graph visualization programs assembled to date: Cytoscape – this tool, based on GINY and Piccolo (see below), is under active use by the bioinformatics community and highly recommended by Bio2RDF.org GINY implements a very innovative system for sub-graphing and allows for stunning visuals.
Sunburst Visualization. Posted in: javascript infovis toolkit , visualization In a previous post I showed the ForceDirected visualization I'm working on for version 1.2 of the JavaScript InfoVis Toolkit, today I'd like to talk about another visualization I've been working on, the Sunburst Visualization.
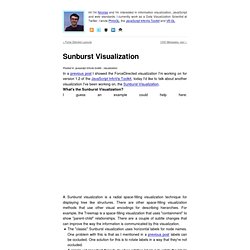
What's the Sunburst Visualization? I guess an example could help here: A Sunburst visualization is a radial space-filling visualization technique for displaying tree like structures. There are other space-filling visualization methods that use other visual encodings for describing hierarchies. For example, the Treemap is a space-filling visualization that uses "containment" to show "parent-child" relationships. Another interesting thing that can be used with the Canvas Text API is the maxWidth parameter. Node Styling and Behavior The visualization also implements events for hovering and clicking nodes. You can also add tool-tips as I did in the example.