
PCR Primer design and PCR setup.
Yhat Sciencebox. We're really excited to announce the release of our newest product, Yhat Sciencebox!
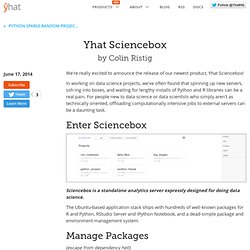
In working on data science projects, we've often found that spinning up new servers, ssh-ing into boxes, and waiting for lengthy installs of Python and R libraries can be a real pain. For people new to data science or data scientists who simply aren't as technically oriented, offloading computationally intensive jobs to external servers can be a daunting task. Enter Sciencebox Sciencebox is a standalone analytics server expressly designed for doing data science. The Ubuntu-based application stack ships with hundreds of well-known packages for R and Python, RStudio Server and IPython Notebook, and a dead-simple package and environment management system. Manage Packages (escape from dependency hell) Sciencebox let's you manage packages and dependencies via the browser. Work in your browser Need a little extra horsepower for your R or Python scripts? Command line goodness (the sb client) Manage your files $ sb sync.
Documentation. Anduril Documentation The next documents and pages will help you using Anduril.
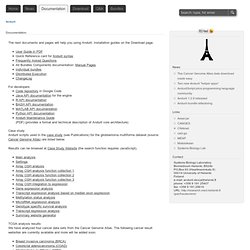
Installation guides on the Download page. For developers Case study Anduril scripts used in the case study (see Publications) for the glioblastoma multiforme dataset (source: Cancer Genome Atlas) are listed below. Results can be browsed at Case Study Website (the search function requires JavaScript). TCGA analysis results. Center for non-coding RNA in Technology and Health - Home. rOpenSci - Open Tools for Open Science. Planning and management charts. Share RGraph: Planning and management charts Funnel charts Shows decreasing (or increasing) quantities progressing through a process Tooltips, custom events, resizable, zoom, context menu, annotatable Key Visual effects Funnel charts documentation <script> var funnel = new RGraph.Funnel('cvs', [100,45,45,26,24]) .set('gutter.right', 150) .set('gutter.left', 150) .set('text.boxed', false) .set('shadow', true) .set('shadow.color', '#ccc') .set('shadow.blur', 5) .set('shadow.offsetx', 5) .set('shadow.offsety', 5) .set('labels', ['Initial contact', 'Established lead', 'Telephone contact', 'Site visit', 'Sale finalised']) .set('labels.x', 10) .set('text.boxed', false) .set('strokestyle', 'rgba(0,0,0,0)') .set('labels.sticks', true) .draw(); </script> Gantt charts Shows planning/management of resources Tooltips, custom events, resizable, zoom, context menu, annotatable Multiple bars per entry Visual effects.
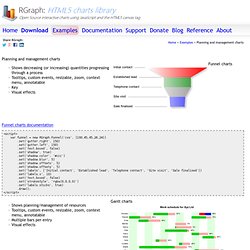
Chart Gallery - Google Charts. How does Practical Data Science with R stand out? There are a lot of good books on statistics, machine learning, analytics, and R.

So it is valid to ask: how does Practical Data Science with R stand out? Why should a data scientist or an aspiring data scientist buy it? We admit, it isn’t the only book we own. Some relevant books from the Win-Vector LLC company library include: And a few more from our digital bookshelf: Collaborative lesson development with GitHub. If you're doing any kind of scientific computing and not using version control, you're doing it wrong.
The git version control system and GitHub, a web-based service for hosting and collaborating on git-controlled projects, have both become wildly popular over the last few years. Late last year GitHub announced that the 10-millionth repository had been created, and Wired recently ran an article reporting on how git and GitHub were being used to version control everything from wedding invitations to Gregorian chants to legal documents. Version control and GitHub-enabled collaboration isn't just for software development anymore.
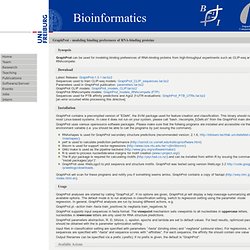
We recently held our second Software Carpentry bootcamp at UVA where I taught the UNIX shell and version control with git. Software Carpentry keeps all its bootcamp lesson material on GitHub, where anyone is free to use these materials and encouraged to contribute back new material. Swcarpentry/bc. Swift. Modern Swift is the result of the latest research on programming languages, combined with decades of experience building Apple platforms.
Named parameters are expressed in a clean syntax that makes APIs in Swift even easier to read and maintain. Even better, you don’t even need to type semi-colons. Inferred types make code cleaner and less prone to mistakes, while modules eliminate headers and provide namespaces. To best support international languages and emoji, Strings are Unicode-correct and use a UTF-8 based encoding to optimize performance for a wide-variety of use cases. Declare new types with modern, straightforward syntax.
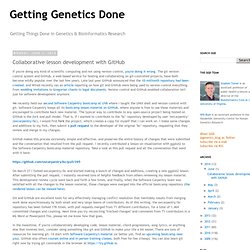
Add functionality to existing types using extensions, and cut down on boilerplate with custom string interpolations. extension Player: Codable, Equatable {} import Foundation let encoder = JSONEncoder() try encoder.encode(player) print(player) Perform powerful custom transformations using streamlined closures. R-Chart. BITS Wiki – RNA-Seq analysis for differential expression. Shiny-server System Performance Monitoring for Open Source Edition - Huidong Tian's Blog. If you have deployed your Shiny-app on internet, you may curious about: how many users are using my app?
Is the server powerful enough for hosting the app? You can get answers through the Server monitoring feature if you are using the Professional edition of Shiny server. What if we are using the Open source edition? Officially, there is no such a feature, but we can create it ourselves using Linux shell commands. Suppose that we have three shiny-apps: app#1, app#2 and app#3.
Using command top, we can get the Process ID (PID), CPU/Memory usage for each shiny app. The above command lists CPU/Memory performance for all shiny apps, e.g. The PID should be paid more attention: each shiny app will get a PID, once a shiny app was launched, its PID will not change no matter how many users are using it. netstat is a command-line tool that displays all network connections. Note, this command need the user log as an administer of the computer. Chair for Bioinformatics Freiburg - GraphProt - modeling binding preferences of RNA-binding proteins. Synopsis.
Features. Gephi is a tool for data analysts and scientists keen to explore and understand graphs. Like Photoshop™ but for graph data, the user interacts with the representation, manipulate the structures, shapes and colors to reveal hidden patterns. The goal is to help data analysts to make hypothesis, intuitively discover patterns, isolate structure singularities or faults during data sourcing. It is a complementary tool to traditional statistics, as visual thinking with interactive interfaces is now recognized to facilitate reasoning. This is a software for Exploratory Data Analysis, a paradigm appeared in the Visual Analytics field of research. Real-time visualization Profit from the fastest graph visualization engine to speed-up understanding and pattern discovery in large graphs.
Layout Layout algorithms give the shape to the graph. Metrics. HTML h1 to h6 tag. Keyboard shortcuts.
Programming. Wordpress. Cup. Molecular techs. Private. TechnologyVendors. Random. MacSoftware.