
Digital Scholarship in the Humanities. Humanities software, visualization and analysis. #alt-academy: Alternative Academic Careers. Nodus Labs. ENGL 668K at the University of Maryland. I wanted to write a last post about some ideas I had and things that happened to me during the course.
I wanted to share them with you and I thought that this was the best place to do that. I enrolled in this course because of the reasons we were and are studying, especially in this last section. I was curious about DH because I like to build and transform things inside the field of literary studies. And I liked the fact that I can do something else in academia more than just writing papers, and I can share my writings with people I knew and unknowns, that they can help me writing and exposing ideas, that I can be creative with the way I presented my ideas, not just written ideas (without having to be a designer), and being in touch with a lot of things that are happening right NOW in many disciplines, especially literature. I never liked the way I studied at the academia, at least in Latin American literature (I do not think English is very different). Books were a sign of power. MIT Technology Review. TeachThoughtTeachThought.
Graphic Sociology » Seeing Social Data. Cairo, Alberto. (2013) The Functional Art: An introduction to information graphics and visualization.
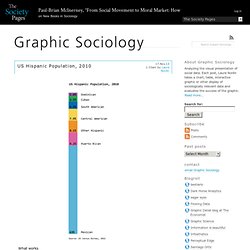
Berkeley: New Riders, a division of Pearson. Overview A functional art is a book in divided into four parts, but really it is easier to understand as only two parts. The first part is a sustained and convincingly argument that information graphics and data visualizations are technologies, not art, and that there are good reasons to follow certain guiding principles when reading and designing them. It is written by Alberto Cairo, a professor of journalism at the University of Miami an information graphics journalist who has had the not always pleasant experience of trying to apply functional rules in organizational structures that occasionally prefer formal rules.
The second part of the book is a series of interviews with journalists, designers, and artists about graphics and the work required to make good ones. What does this book do well? Diversity What doesn’t this book do well? Summary. Datafication: How the Lens of Data Changes How We See Ourselves. Digital media allow us to produce, collect, organise and interpret more data about our lives than ever before.
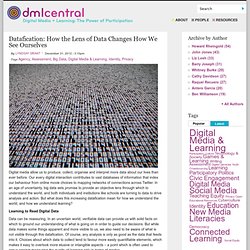
Our every digital interaction contributes to vast databases of information that index our behaviour from online movie choices to mapping networks of connections across Twitter. In an age of uncertainty, big data sets promise to provide an objective lens through which to understand the world, and both individuals and institutions like schools are turning to data to drive analysis and action. But what does this increasing datafication mean for how we understand the world, and how we understand learning? Learning to Read Digital Data Data can be reassuring. But our interpretation of data is also skewed by how that data is represented. Digital Humanities Now. Humanities software, visualization and analysis.