
6302.0 - Average Weekly Earnings, Australia, May 2016. The following table contains the key Average Weekly Earnings figures for the May 2016 reference period.
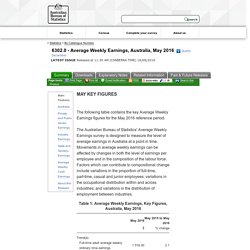
The Australian Bureau of Statistics' Average Weekly Earnings survey is designed to measure the level of average earnings in Australia at a point in time. Movements in average weekly earnings can be affected by changes in both the level of earnings per employee and in the composition of the labour force. Factors which can contribute to compositional change include variations in the proportion of full-time, part-time, casual and junior employees; variations in the occupational distribution within and across industries; and variations in the distribution of employment between industries. Life expectancy. Life expectancy is the most commonly used measure to describe population health and reflects the overall mortality level of a population.
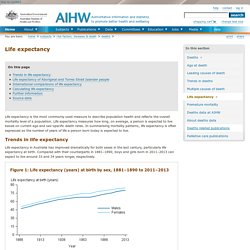
Life expectancy measures how long, on average, a person is expected to live based on current age and sex-specific death rates. In summarising mortality patterns, life expectancy is often expressed as the number of years of life a person born today is expected to live. Trends in life expectancy Life expectancy in Australia has improved dramatically for both sexes in the last century, particularly life expectancy at birth. Compared with their counterparts in 1881–1890, boys and girls born in 2011–2013 can expect to live around 33 and 34 years longer, respectively.
Figure 1: Life expectancy (years) at birth by sex, 1881–1890 to 2011–2013 Sources: ABS 2014a; ABS 2014b (Table S1). Life expectancy changes over the course of a person’s life because as they survive the periods of birth, childhood and adolescence, their chance of reaching older age increases. Physical education, school physical activity, school sports and academic performance.
Quasi-experimental and longitudinal studies It is not surprising that no randomized controlled trials were identified, as they are not practicable in this type of research setting.
Quasi-experimental protocols are usually indicated when causality cannot be tested by a random controlled trial in milieux such as the school setting. Seven quasi-experimental studies were identified (Table 1). Cross-sectional studies were also considered, as well as experimental or laboratory experiments on the determinants of academic performance (i.e. learning concentration, classroom behaviour, etc.). A second quasi-experimental study conducted in the Trois-Rivières region (Québec) between 1970 and 1977 involved 546 primary school students; this noted that students involved in an experimental 5 hours of physical education per week had a higher academic performance than their control counterparts who were enrolled in the normal school program for 40 min per week [8].
The 16-month Action School BC! 5518.0.55.001 - Government Finance Statistics, Education, Australia, 2014-15. <h4>Please enable javascript to see the dynamic graph content</h4> This release contains statistics on expenditure on education by the general government sector for the period 2005-06 to 2014-15.
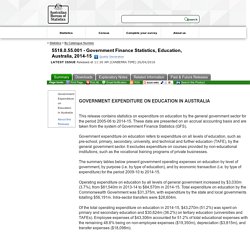
These data are presented on an accrual accounting basis and are taken from the system of Government Finance Statistics (GFS). Government expenditure on education refers to expenditure on all levels of education, such as pre-school, primary, secondary, university, and technical and further education (TAFE), by the general government sector. It excludes expenditure on courses provided by non-educational institutions, such as the vocational training programs of private businesses. The summary tables below present government operating expenses on education by level of government, by purpose (i.e. by type of education), and by economic transaction (i.e. by type of expenditure) for the period 2009-10 to 2014-15.
Document Selection These documents will be presented in a new window. 6202.0 - Labour Force, Australia, Jun 2016. Employment increased 8,300 to 11,933,400.
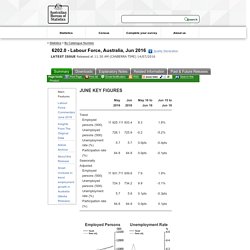
Unemployment decreased 200 to 725,900. Unemployment rate remained steady at 5.7%. Participation rate remained steady at 64.8%. Monthly hours worked in all jobs decreased 0.7 million hours to 1,635.1 million hours. Employment increased 7,900 to 11,939,600. Each year the Monthly hours worked in all jobs series is benchmarked to an annual hours worked level. The estimates in this publication are based on a sample survey. For further information about these and related statistics, email <client.services@abs.gov.au> or contact the National Information and Referral Service on 1300 135 070. 2012. Education System in Vietnam. Overseas study in Vietnam Overseas education has become increasingly popular in recent years as it is viewed as offering the student likelihood of better future employment.
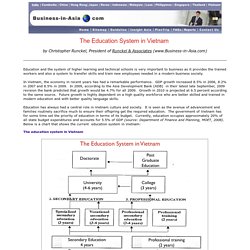
Overseas study can be either by scholarship or through personal finances. The overseas-study consulting market in Vietnam is highly competitive. Hundreds of education consulting centers and non-profit organizations are operating in the big cities. Moreover, the internet also gives students the ability to find the scholarships and the school and the opportunities to go oversea to study by themselves. Over 60,000 students in Vietnam are now studying overseas according to the Foreign Press Center and based on statistics from MOET.