Periscopic: Do good with data. Colorbrewer: Color Advice for Maps. Journalisme graphique. Dataviz : une belle boîte à outils | Fourre tout Numerik. Datavisualization.ch Selected Tools. EXPOVIZ. Datavisualisation : ce n’est que le début !
La datavisualisation, un langage « pop » La visualisation de données, auparavant limitée à la recherche et au monde scientifique, s’est démocratisée pour devenir "pop culture". Elle s’adapte à une culture dans laquelle on scanne plus qu’on ne lit. Elle offre un mode de représentation de l’information plus rapide et plus impactant que le texte descriptif. "Aujourd’hui, on a besoin d’indicateurs chiffrés. Tout est de plus en plus mesuré : performances, résultats, prévisions... "Il faut s’extraire de l’anecdote et du flux pour dégager les tendances", complète Delphine Pinel, Directrice associée de l’agence Angie. La datavisualisation, un langage interactif "La visualisation doit devenir interactive pour plonger l’usager dans le jeu avec les données", indique Delphine Pinel. Acteur de l’information, l’internaute adopte un changement de posture par rapport à l’internaute / lecteur traditionnel.
La datavisualisation, un langage de datas… et de mots. Tools on Datavisualization. A Carefully Selected List of Recommended Tools 07 May 2012 Tools Flash, JavaScript, Processing, R When I meet with people and talk about our work, I get asked a lot what technology we use to create interactive and dynamic data visualizations. 
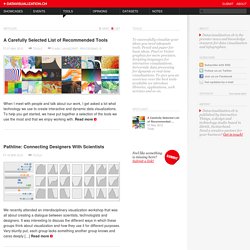
To help you get started, we have put together a selection of the tools we use the most and that we enjoy working with. Read more Pathline: Connecting Designers With Scientists 18 Apr 2012 Tools We recently attended an interdisciplinary visualization workshop that was all about creating a dialogue between scientists, technologists and designers.
New Maps for the Web by Stamen 22 Mar 2012 Tools JavaScript, Mapping I just left the Stamen studio where I had a brief chat with founder and CEO Eric Rodenbeck. The Visualizing Player 19 Jul 2011 Showcases, Tools Visualizing.org launched their brand new Visualizing Player, a terrific tool for embedding interactive and static data visualizations. Working with Data in Protovis 17 Feb 2011 Tools JavaScript, Tutorial.