
MinFraud Overview. Gephi - The Open Graph Viz Platform. 10 astuces pour améliorer vos documents en R markdown - Statistiques et logiciel R. Introduction aux outils d’analyse de données et à R. Première démo : Les participants renseignent le formulaire ( qui demande des informations basiques sur les participants.
Ce formulaire sert de démonstration des usages potentiels de R. Comment connecter un simple formulaire Google Form, ses données récoltées dans un tableur et les visualiser très simplement avec des petits modules de graphes ou de cartes sur une page HTML construite automatiquement. Le formateur a créé préalablement un code R qui permet de visualiser en temps réel un dashboard qui présente les résultats. La force de R, c’est de permettre d’utiliser un code simple et concis (70 lignes dans ce cas). La donnée ? Selon vous, qu’est ce qu’une donnée ? Comment ouvrir des données et se demander lesquelles sont à ouvrir ou pas? RStudio Preview - RStudio. RStudio v1.2.907-1 Preview — Release Notes A preview release of RStudio v1.2.907-1 is now available for testing and feedback.
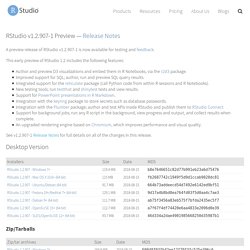
This early preview of RStudio 1.2 includes the following features: Author and preview D3 visualizations and embed them in R Notebooks, via the r2d3 package.Improved support for SQL; author, run and preview SQL query results.Integrated support for the reticulate package (call Python code from within R sessions and R Notebooks).New testing tools; run testthat and shinytest tests and view results.Support for PowerPoint presentations in R Markdown.Integration with the keyring package to store secrets such as database passwords.Integration with the Plumber package; author and test APIs inside RStudio and publish them to RStudio ConnectSupport for background jobs; run any R script in the background, view progress and output, and collect results when complete.An upgraded rendering engine based on Chromium, which improves performance and visual quality.
Desktop Version. R: The R Project for Statistical Computing. Gephi makes graphs handy. Gephi - The Open Graph Viz Platform. JavaScript InfoVis Toolkit. Observable. Observable. Observable. D3.js - Data-Driven Documents. Dygraphs JavaScript Visualization Library. JavaScript Charts in one powerful declarative library. InstantAtlas – visualize. : An unexpected error has occurred. La Business Intelligence pour tous.
Open source HTML5 Charts for your website. Attention Required! The 38 best tools for data visualization. Data isn't a thing that's easy for the average person to grasp.
While some can look through a spreadsheet and instinctively find the information they need within a mass of figures, the rest of us need a little help, and that's where data visualisation can be a real help. For the designer, the challenge is not only in rendering a set of data in an informative way, but also in presenting it so that it that stands out from the mass of competing data streams. Get Adobe Creative Cloud One of the best ways to get your message across is to use a visualisation to quickly draw attention to the key messages, and by presenting data visually, it's also possible to uncover surprising patterns and observations that wouldn't be apparent from looking at stats alone. And nowadays, there's plenty of free graphic design software to help you do just that. There are many different ways of telling a story, but everything starts with an idea. 01. 02. GeoDa on Github. GeoDa Release This GeoDa 1.12 is the most current version of GeoDa with new features.
We found it to be stable but if you encounter a bug, please let us know. You can also report bugs and issues on our Github site. This version is continuously updated when bugs are fixed. Milestones in the History of Thematic Cartography, Statistical Graphics, and Data Visualization. Data Is Beautiful. RAWGraphs. RAW Graphs is an open source data visualization framework built with the goal of making the visual representation of complex data easy for everyone. Primarily conceived as a tool for designers and vis geeks, RAW Graphs aims at providing a missing link between spreadsheet applications (e.g. Microsoft Excel, Apple Numbers, OpenRefine) and vector graphics editors (e.g. Adobe Illustrator, Inkscape, Sketch). The project, led and maintained by the DensityDesign Research Lab (Politecnico di Milano) was released publicly in 2013 and is regarded by many as one of the most important tools in the field of data visualization.
After a couple of years, the involvement of Contactlab as a funding partner brought the project to a new stage. If you have found RAWGraphs useful in your research, or if you want to reference it in your work, please consider to cite the paper we presented at CHItaly 2017. Cite RAWGraphs: Mauri, M., Elli, T., Caviglia, G., Uboldi, G., & Azzi, M. (2017). Bibtex: Free Infographic Maker. Meilleurs exemples de graphiques, rapports, infographies et cartes. Les tableaux de bord sont utilisés pour la gestion des informations afin de fournir un aperçu des principaux indicateurs de performance (KPI) d'une entreprise.
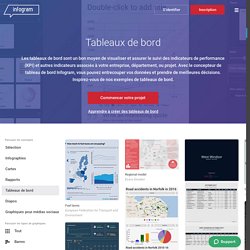
Les tableaux de bord organisent, stockent et affichent les informations essentielles provenant de diverses sources de données afin de faciliter l'identification des tendances, la création de parallèles et la vue d'ensemble. Que ce soit votre entreprise, un service spécifique ou un projet, les tableaux de bord sont les outils incontournables pour collecter des données et prendre de meilleures décisions commerciales. Pourquoi ne pas utiliser plusieurs rapports ?