
La boite à outils. 30 Simple Tools For Data Visualization. There have never been more technologies available to collect, examine, and render data.
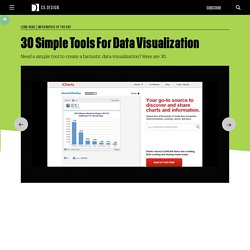
Here are 30 different notable pieces of data visualization software good for any designer's repertoire. They're not just powerful; they're easy to use. In fact, most of these tools feature simple, point-and-click interfaces, and don’t require that you possess any particular coding knowledge or invest in any significant training. Let the software do the hard work for you. Your client will never know. 1. iCharts 2. FusionCharts Suite XT is a professional and premium JavaScript chart library that enables us to create any type of chart. 3. Modest Maps is a small, extensible, and free library for designers and developers who want to use interactive maps in their own projects. 4. Pizza Pie Charts is a responsive pie chart based on the Snap SVG framework from Adobe.
DATA Visualization - ChartsBin.com. Create and design your own charts and diagrams online. DATA Visualization - ChartGo - Graph and Charts Fast, Easy and Free. Setting up an internal data analytics practice – some thoughts from a wayfarer. Introduction This year has been hugely exciting so far: I’ve been exploring and playing with various techniques that fall under the general categories of data mining and text analytics.
What’s been particularly satisfying is that I’ve been fortunate to find meaningful applications for these techniques within my organization. Although I have a fair way to travel yet, I’ve learnt that common wisdom about data analytics – especially the stuff that comes from software vendors and high-end consultancies – can be misleading, even plain wrong. Hence this post in which I dispatch some myths and share a few pointers on establishing data analytics capabilities within an organization. Busting a few myths Let’s get right to it by taking a critical look at a few myths about setting up an internal data analytics practice. Requires high-end technology and a big budget: this myth is easy to bust because I can speak from recent experience.
Getting started Parting thoughts Like this: Like Loading... Polinode - Delivering Deep Insights via Network Analysis. A dataset for distant-reading literature in English, 1700-1922. Literary critics have been having a speculative conversation about close and distant reading.
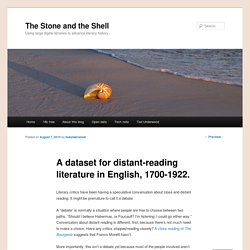
It might be premature to call it a debate. A “debate” is normally a situation where people are free to choose between two paths. “Should I believe Habermas, or Foucault? I’m listening; I could go either way.” Conversation about distant reading is different, first, because there’s not much need to make a choice. More importantly, this isn’t a debate yet because most of the people involved aren’t free to explore both paths. A dataset for distant reading To reduce barriers to entry, I’ve collaborated with HathiTrust Research Center to create an easier place to start with English-language literature. HathiTrust contains more than a million volumes in English between 1700 and 1922. However, many literary scholars are mainly concerned with books in a particular genre — they limit their inquiries, say, to “poetry” or “prose fiction.”
Three big blocks of stone. HTRC Portal - Word Frequencies in English-Language Literature, 1700-1922. Note that this is a beta data release.
Please send feedback to tunder@illinois.edu. Many of the questions scholars want to ask about large collections of text can be posed using simplified representations – for instance, a list of the words in each volume, together with their frequencies. This dataset represents a first attempt to provide that information for English-language fiction, drama, and poetry published between 1700 and 1922, and contained in the HathiTrust Digital Library.
The project combines two sources of information. The word counts themselves come from the HathiTrust Research Center (HTRC), which has tabulated them at the page level in 4.8 million public-domain volumes. Because both of these projects mapped volumes at the page level, their results can be collated to produce genre-specific datasets. To provide an even easier point of access, we have also created yearly summary files for each genre. 6.1.4. Big Data. NoSQL. Data visualisation tools. Lorna M. Hughes. NeMO: NeDiMAH Methods Ontology launched!
I’m delighted to announce the launch of NeMO, The NeDiMAH Methods Ontology, a major new component of the international digital humanities research infrastructure. Background: NeDiMAH, and understanding Digital Humanities in Practice NeDiMAH was a ESF Research Networking Programme (RNP) funded from May 2011-May 2015. It was a collaboration of 16 ESF Member organisations, and was co-Chaired by myself, Susan Schreibman (University of Maynooth, Ireland) and Fotis Jannidis (University of Würzburg, Germany, from 2011-14). NeDiMAH brought into partnership the digital humanities researchers of16 NeDiMAH Member countries (Bulgaria, Croatia, Denmark, Finland, France, Germany, Hungary, Ireland, Luxembourg, the Netherlands, Norway, Portugal, Romania, Sweden, Switzerland, and the UK. This work will be the basis for future knowledge production in the humanities that takes advantage of digital tools, methods and content.
About NeMO. Datavisualization.ch Selected Tools.