
World Cup Brazil 2014 - infographic on Behance. Vignelli Center for Design Studies. Graduate Graphic Design students examine and explain many different aspects of human health in a book produced in partnership with the Vignelli Center’s MeDesign initiative.

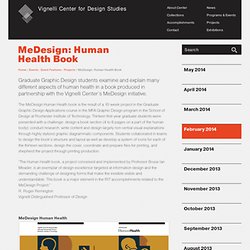
The MeDesign Human Health book is the result of a 10-week project in the Graduate Graphic Design Applications course in the MFA Graphic Design program in the School of Design at Rochester Institute of Technology. Thirteen first-year graduate students were presented with a challenge: design a book section (4 to 6 pages on a part of the human body); conduct research, write content and design largely non-verbal visual explanations through highly stylized graphic diagrammatic components. Students collaborated in teams to design the book’s structure and layout as well as develop a system of icons for each of the thirteen sections, design the cover, coordinate and prepare files for printing, and shepherd the project through printing production. MeDesign Human Health Cover design by Jia Cai Sara Almudhaf Skin Jia Cai Joints.
MagnaGlobal Ad Markets Poster on Behance. IPG Media Economy Report Vol.3 on Behance. 10 grandiose Anlaufstellen für Infografiken bei Pinterest. Bei Pinterest (www.pinterest.com) geht es mitnichten nur um hübsche Kleider, schicke Schuhe oder tolle Handtaschen.

Der neue Stern am Internet-Himmel ist auch ein idealer Tummelplatz für Comic-Nerds, Architektur-Freaks und Anhänger von spannenden, sehenswerten und faszinierenden Infografiken. deutsche-startups.de selbst präsentiert in seinem brandneuen Pintrest-Account bereits über 100 Infografiken zu allen denkbaren Online-Themen (unter anderem Twitter, Facebook, Instagram, Social Media, SEO und Online-Marketing). Da wir aber auch gerne über den Tellerrand schauen, empfiehlt die Redaktion von deutsche-startups.de an dieser Stelle 10 Anlaufstellen für Infografik-Freaks bei Pinterest. deutsche-startups.de – Infografiken Daniel Backhaus – Infographics Gabriella Tooth – Infographics Christine Pfeil – Social Media Klaus Eck – Infografiken Nicole Bullock – Infographics Christoph Müller-Girod – Social Media Otto Normal – 666 Patrick Garmoe – Infographics t3n.de – Infografiken Foto: istockphoto.
Female_orgasm_facts.jpg (JPEG Image, 560x3750 pixels) - Scaled (17%) Column Five Media: Infographics, Content Strategy, Interactive Design. Perle di saggezza per le startup tumblr_l211uk0TWs1qz6pqio1_500 – Il Post. Cool Infographics - Blog. Sitting kills. Some facts about Nuclear weapons. This shit is crazy. via.
Bv_designer_final.jpg (JPEG Image, 1200x3688 pixels) - Scaled (17%) The Value of Data Visualization. The World's Abortion Laws 2011. Dreams-Meaning-Infographic.jpg (JPEG Image, 630x1350 pixels) - Scaled (47%) Popular Mechanics Infographics on the Behance Network.
Visualizing.org. What Social Media Users Think of the Hottest Tech Stories [INFOGRAPHIC] Get your fingers on the pulse of the social media community with this survey conducted by Lab42.
![What Social Media Users Think of the Hottest Tech Stories [INFOGRAPHIC]](http://cdn.pearltrees.com/s/pic/th/hottest-stories-infographic-17383189)
It'll get you caught up on the hot tech issues of the past couple of weeks. For the data embedded in this infographic, market research firm Lab42 conducted a study online via social networks between Sept. 30 and Oct. 23, 2011 among 500 social media users, asking them questions about the iPhone 4S, Kindle Fire, Netflix, the radical changes in Facebook and more. It's a tight wrapup of the issues we care about. One ominous takeaway we noticed: Look out, Netflix — a surprisingly large proportion of your social-media-using customers are just about to jump ship: Infographic courtesy Lab42. Work. 2011: A Techrospective [Infographic]