
Videohive. 25+ Best After Effects Project Files Info-Graphics. That time is not very far when you, yourself, will decide on creating your own animation or introducing your own brand or company and that is the time when you will find free after-effects templates extremely helpful as well as useful.
If you have ever intended at promoting your website for a very long period of time, you have probably made use of one of the promo after-effect templates. In addition to this, if you have a business section in your website, you can always use these after-effect templates for successful business presentations. Sometimes you may not have ample time to spend in thinking of some creative idea that will turn your animation into something extraordinary. Also, some people are not even creative enough in making animations. After-effects is a great tool when it comes to editing videos and/or making creative animations.
20 Inspiring Animated Infographics. We here at Infographic World have recently begun to offer Animated infographics to our clients And as such we of course took to the web for inspiration to see just what the best animated graphics on the web had to offer.
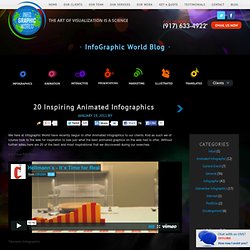
Without further adieu here are 20 of the best and most inspirational that we discovered during our searches. It’s Time For Real Tsunami Infographic The Crisis Of Credit. Designing Quality Infographics: Tips, Resources and Inspiration. Infographics are graphic visual representations of data and information.
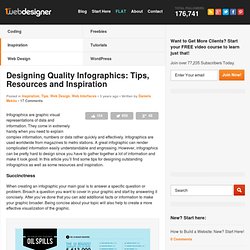
They come in extremely handy when you need to explain complex information, numbers or data rather quickly and effectively. Infographics are used worldwide from magazines to metro stations. Eu sou... Designer de informação. Imagine se as reuniões e palestras intermináveis sobre resultados fiscais corporativos pudessem ser traduzidas em um painel colorido, cheio de desenhos e pouco texto, de forma clara e organizada.
No que depender da designer de informação Mila Motomura, isso já é realidade. Data Visualization, Infographics, and Statistics. Www.field-studies-council.org/media/474642/googlechartsgeneratorinstructions.pdf. How to make 3D Pie Chart in Google Earth. Hispanic Advertising - Using Sketchup To Extrude 3D Advertising Graphics « Ed Schipul. Hispanic Advertising – Using Sketchup To Extrude 3D Advertising Graphics We recently closed a client in the Hispanic advertising space so I was reading the AdAge Hispanic Fact Pack.
This, crossed with recently going through the initial tutorial in Google Sketchup made me want to play with the pie chart as a 3D infographic for better visualization. I did not do that. By no stretch does this graphic do a better job of conveying the information than the flat pie chart. This is just a proof of concept. But, it was a fun journey and I thought it might be helpful to explain the process of converting a pie chart into a 3D visual using Sketchup. After the jump you can see the step-by-step process used and download the source files to continue editing it.
Step 1 - View the AdAge 2005 Hispanic Fact Pack and convert that to a small Excel sheet. Step 2 - Generate an Excel Graph from the Spreadsheet – close to the defaults. Step 4 – Use the Arc tool and the Pencil tool to draw the pie chart shapes. Download pptPlex from Official Microsoft Download Center. Data Visualizations, Challenges, Community.
Beautiful web-based timeline software. Infographic Presentation by Aubrey Miller on Prezi. 10 Awesome Free Tools To Make Infographics. Advertisement Who can resist a colourful, thoughtful venn diagram anyway?

In terms of blogging success, infographics are far more likely to be shared than your average blog post. This means more eyeballs on your important information, more people rallying for your cause, more backlinks and more visits to your blog. In short, a quality infographic done well could be what your blog needs right now. Faz Caber » Como o Excel pode salvar sua vida. Quando falamos de infografia, ás vezes parece que os únicos softwares que você precisa conhecer são Adobe Illustrator, algo de Photoshop, com 3D e Flash como opcionais.
G1 – Política – Infográfico do Mensalão » Página não encontrada. O criar infográficos em poucos passos. Como fazer um infográfico. Free infographic app. Vizualize.me: Visualize your resume in one click. 3D animation + 3D visualizations + motion graphics + design - Washington DC, Virginia, Maryland. Login. Instructional and Educational Videos, Animated Explanations, - Explania. 21 Effective Infographic Animations using Stylish Typography. Introduction Infographics are visual illustrations that use a variety of symbols, and diagrams to portray or teach an informative lesson or story.
Combined with kinetic typography and skillful animation, these animated infographics become interesting and engaging for the audience and hopefully inform us with valuable information. Formato de Documento Computável (CDF) para Conteúdo Interativo. Mural.ly. Charts Made Easy. Data Made Social. 20+ Tools to Create Your Own Infographics. A picture is worth a thousand words – based on this, infographics would carry hundreds of thousands of words, yet if you let a reader choose between a full-length 1000-word article and an infographic that needs a few scroll-downs, they’d probably prefer absorbing information straight from the infographic.
What’s not to like? Colored charts and illustrations deliver connections better than tables and figures and as users spend time looking back and forth the full infographic, they stay on the site longer. Plus, readers who like what they see are more likely to share visual guides more than articles. While not everyone can make infographics from scratch, there are tools available on the Web that will help you create your very own infographics. In this article, we’re listing more than 20 such options to help you get your messages across to your readers, visually. 20 Inspiring Animated Infographics. Facebook Infographic. Free Infographic Vector Elements by ~Pixeden on deviantART. Create and share visual ideas online. Download Infographics Vector Templates For Free.
Infographic is a informative graph for the people and new trend of graphic, people can easy get the information about the technologies, social network users, and about other varieties of things through infographics, people can get the new or popular trend of the time, people also like to create infographics designs to share their information with people, you can also use free vector template of the infographics, you have not to strive to create infographic design that attract others towards your infographic design, you can use free vector templates of infographic designs, or share your information with the people of the world.
After Effects Templates. Onde atuam os 736 jogadores da Copa 2010:Especial - Esportes - Copa 2010 - Estadão.com.br. 10 recursos para visualizar os resultados das eleições. A maioria dos munícipes brasileiros acordou hoje sabendo quem irá comandar nos próximos quatro anos o Executivo e Legislativo local.
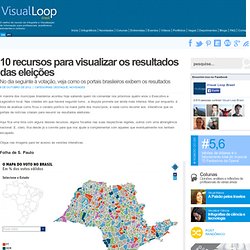
Nas cidades em que haverá segundo turno , a disputa promete ser ainda mais intensa. Mas por enquanto, é hora de analisar como ficou o cenário político na maior parte dos municípios, e nada como recorrer aos interativos que os portais de notícias criaram para resumir os resultados eleitorais. Aqui fica uma lista com alguns desses recursos, alguns focados nas suas respectivas regiões, outros com uma abrangência nacional. E, claro, fica desde já o convite para que nos ajude a complementar com aqueles que eventualmente nos tenham escapado. Infograficos interativos - Google Search. Top Ten Free Tools To Create Awesome Infographics.
Information graphics or infographics as it is generally called are graphical or visual representation of information. It’s an efficient means to present complex information or knowledge in a simple and clear way without any complications. All through the years, this serves as an excellent means for computer scientists, statisticians and different technicians to develop and deliver different concepts using certain symbols that have specific meanings in different processes. These symbols serve as descriptions for certain concepts or processes and hence are helpful in representing information. Today, you can see information graphics in each every aspect of life including scientific and pedestrian styles. Data Visualization Blog. Content alone does not make a great video; you need a great video design that make a visual statement combining design and data visualization to deliver a story.
Designers often get a little excited and put too much fancy design to fill in the space. The best content marketing brands are the ones that know how use content to drive conversions and pushing the boundaries. Keep in mind, quality = attention span. The Timber Trade. STATISTICS - Info Graphics Solution. Piktochart- Infographic & Presentation Tool. Seven Online Infographic Builders That You Have to Try. The world is becoming increasingly visual – especially the online world. Thanks to social media and the explosion of sites such as Pinterest, displaying information in a visual way has become even more important. How it Works. FluxVFX. Infographics Version 2. Understanding the Financial Crisis - very well explanation! Infographic Design 101: Creating fun and accurate timelines in Adobe Illustrator. How to design using infographics. Clickx 258: Infogram. “Our Choice”, a Interatividade em Livro.
Al Gore quer mudar a dinâmica de leitura. Ele acaba de lançar no iTunnes o livro Our Choice. Www.abed.org.br/congresso2009/CD/trabalhos/1352009201831.pdf. Espaço de apresentação e debate de ideias sobre educação e mais… Época - NOTÍCIAS - O mapa eleitoral do Brasil. Graphs Infographics. Infografiria. Introdução à Visualização de Informação: curso gratuito. 50 Excellent Examples of Infographic Maps. Infographic is very interactive and creative way to deliver data. Infographics are widely used to present complex knowledge or data in a simplest and easy way. If you search the net you will find a big range of interactive and graphical maps. These infographic maps clearly illustrate the topic in a very simple manner. Here is a collection of superb and excellent examples of infographic maps for your inspiration. by 1. by rosefirerising 2. by JewelInfo4u.com 3. by guidafonseca.
Infographic step-by step - Multimedia Learning Stuff. « Back to blog Como Jesus foi crucificado? Editora Abril/Revista Mundo Estranho. Março 2009. Renata Steffen, da Folha de S.