
What is the tidyverse? By Joseph Rickert Last week, I had the opportunity to talk to a group of Master’s level Statistics and Business Analytics students at Cal State East Bay about R and Data Science.
Many in my audience were adult students coming back to school with job experience writing code in Java, Python and SAS. It was a pretty sophisticated crowd, but not surprisingly, their R skills were stitched together in a way that left some big gaps. Many for example, didn’t fully understand the importance of CRAN Task Views as curated source for the best packages to support their work in machine learning, time series and the other areas of Statistics they were studying. So, it made sense that even though ggplot2 and dplyr were mentioned in some of the student’s questions, a faculty member present asked: “What is the tidyverse?” There is an incredible amount of good material available online about the tidyverse, and I will point to some of that below. The Basics.
Contributing Code to the Tidyverse. Posted on August 8, 2017 Contributing code to open source projects can be intimidating.
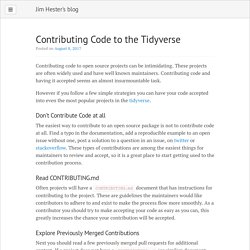
These projects are often widely used and have well known maintainers. Contributing code and having it accepted seems an almost insurmountable task. However if you follow a few simple strategies you can have your code accepted into even the most popular projects in the tidyverse. The tidy tools manifesto. Hadley Wickham This document lays out the consistent principles that unify the packages in the tidyverse.
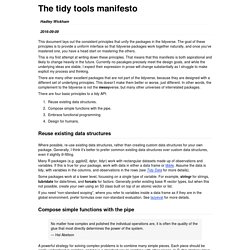
The goal of these principles is to provide a uniform interface so that tidyverse packages work together naturally, and once you’ve mastered one, you have a head start on mastering the others. This is my first attempt at writing down these principles. That means that this manifesto is both aspirational and likely to change heavily in the future. Currently no pacakges precisely meet the design goals, and while the underlying ideas are stable, I expect their expression in prose will change substantially as I struggle to make explicit my process and thinking. Tidy data. (This is an informal and code heavy version of the full tidy data paper.
Please refer to that for more details.) Tidyverse Basics. Data Wrangling with R and the Tidyverse. New features in R 4.1.0. Rejoice!

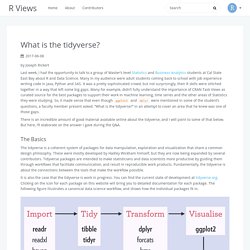
A new R release (v 4.1.0) is due on 18th May 2021. Typically most major R releases don’t contain that many new features, but this release does contain some interesting and important changes. This post summarises some of the notable changes introduced. More detail on the changes can be found at the R changelog. The 4 Pipes of magrittr. The magrittr package is a part of the extended tidyverse – i.e., not one of the ones normally loaded.
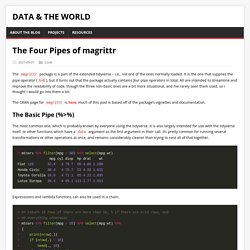
It is the one that supplies the pipe operator (%>%), but it turns out that the package actually contains four pipe operators in total. All are intended to streamline and improve the readability of code, though the three non-basic ones are a bit more situational, and I’ve rarely seen them used, so I thought I would go into them a bit. The CRAN page for magrittr is here; much of this post is based off of the package’s vignettes and documentation.
The Basic Pipe (%>%) The most common one, which is probably known by everyone using the tidyverse. There are now 3 different R pipes. R 4.1.0 has been released and has a couple of handy new features.
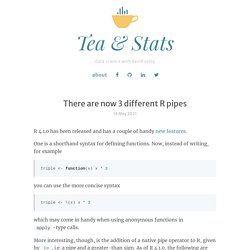
One is a shorthand syntax for defining functions. Now, instead of writing, for example triple <- function(x) x * 3 you can use the more concise syntax. Data Processing with dplyr & tidyr. Data Wrangling Part 1: Basic to Advanced Ways to Select Columns. Dplyr: select vars using set operations. Create new variables with mutate_at while keeping the original ones. Dplyr equivalents of complete.cases() and na.omit()
Dplyr debugging tip: browser() inside mutate() Countess: Helpers for "dplyr"'s "count" Function. Cheatsheet for dplyr join functions. Why the cheatsheet Examples for those of us who don’t speak SQL so good.
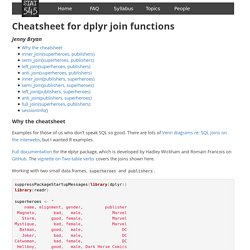
There are lots of Venn diagrams re: SQL joins on the interwebs, but I wanted R examples. Full documentation for the dplyr package, which is developed by Hadley Wickham and Romain Francois on GitHub. The vignette on Two-table verbs covers the joins shown here. Working with two small data.frames, superheroes and publishers. suppressPackageStartupMessages(library(dplyr))library(readr) superheroes <- " name, alignment, gender, publisher Magneto, bad, male, Marvel Storm, good, female, Marvel Mystique, bad, female, Marvel Batman, good, male, DC Joker, bad, male, DC Catwoman, bad, female, DC Hellboy, good, male, Dark Horse Comics "superheroes <- read_csv(superheroes, trim_ws = TRUE, skip = 1) publishers <- " publisher, yr_founded DC, 1934 Marvel, 1939 Image, 1992 "publishers <- read_csv(publishers, trim_ws = TRUE, skip = 1) Sorry, cheat sheet does not illustrate “multiple match” situations terribly well.
The unequalled joy of non-equi joins. A common task in data analysis is to merge or join two tables according to shared keys or values.
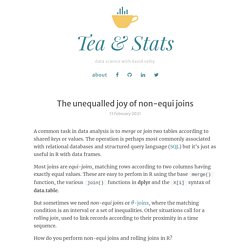
The operation is perhaps most commonly associated with relational databases and structured query language (SQL) but it’s just as useful in R with data frames. Most joins are equi-joins, matching rows according to two columns having exactly equal values. These are easy to perfom in R using the base merge() function, the various join() functions in dplyr and the X[i] syntax of data.table. Tidy Animated Verbs. Certifiably Gone Phishing.
Gives examples of how to save intermediate results from within a pipeline, e.g. z <- iris %>% filter(Species == "setosa") %>% {z_nrow <<- nrow(.); .} %>% summarise_if(is.numeric, mean) %>% {z_nrow2 <<- nrow(.); .} – alanyeung
GitHub - dgrtwo/fuzzyjoin: Join tables together on inexact matching. Funneljoin: Join tables based on events occurring in sequence in a funnel. Defining Your Own Binary Operators. GitHub - nteetor/zeallot: Variable assignment with zeal! (or multiple, unpacking, and destructuring assignment in R) Janitor vignette. The janitor functions expedite the initial data exploration and cleaning that comes with any new data set.
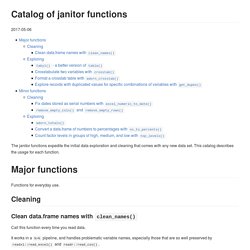
This catalog describes the usage for each function. Functions for everyday use. Assertive R Programming with assertr. Tony Fischetti In data analysis workflows that depend on un-sanitized data sets from external sources, it’s very common that errors in data bring an analysis to a screeching halt.
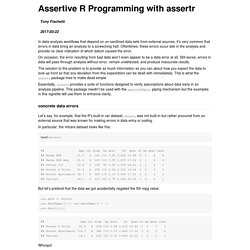
Oftentimes, these errors occur late in the analysis and provide no clear indication of which datum caused the error. On occasion, the error resulting from bad data won’t even appear to be a data error at all. Tidypredict - tidypredict. Conflicted: a new approach to resolving ambiguity. Tidylog: feedback on dplyr operations. Clean: Fast and Easy Data Cleaning. The R package for cleaning and checking data columns in a fast and easy way. Relying on very few dependencies, it provides smart guessing, but with user options to override anything if needed. It also provides two new data types that are not available in base R: currency and percentage.
As a data scientist, I’m often served with data that is not clean, not tidy and consquently not ready for analysis at all. For tidying data, there’s of course the tidyverse ( which lets you manipulate data in any way you can think of. But for cleaning, I think our community was still lacking a neat solution that makes data cleaning fast and easy with functions that kind of ‘think on their own’ to do that.
If the CRAN button at the top of this page is green, install the package with: Otherwise, or if you are looking for the latest stable development version, install the package with: Intro to reshape2. October 19, 2013 reshape2 is an R package written by Hadley Wickham that makes it easy to transform data between wide and long formats. Wide data has a column for each variable. For example, this is wide-format data: # ozone wind temp # 1 23.62 11.623 65.55 # 2 29.44 10.267 79.10 # 3 59.12 8.942 83.90 # 4 59.96 8.794 83.97.
Pivoting data from columns to rows (and back!) in the tidyverse. TLDR: This tutorial was prompted by the recent changes to the tidyr package (see the tweet from Hadley Wickham below). Two functions for reshaping columns and rows (gather() and spread()) were replaced with tidyr::pivot_longer() and tidyr::pivot_wider() functions. Thanks to all 2649 (!!!) People who completed my survey about table shapes! I’ve done analysed the data at and the new functions will be called pivot_longer() and pivot_wider() #rstats— Hadley Wickham (@hadleywickham) March 24, 2019 Load packages. Graphical Intro to tidyr's pivot_*() Tidy evaluation in 5 mins. Lazy evaluation - Jenny Bryan. The "tidy eval" framework is implemented in the rlang package and is rolling out in packages across the tidyverse and beyond.
There is a lively conversation these days, as people come to terms with tidy eval and share their struggles and successes with the community. Why is this such a big deal? For starters, never before have so many people engaged with R's lazy evaluation model and been encouraged and/or required to manipulate it. I'll cover some background fundamentals that provide the rationale for tidy eval and that equip you to get the most from other talks. Jenny is a recovering biostatistician who takes special delight in eliminating the small agonies of data analysis. Tidy evaluation: programming with ggplot2 and dplyr. Standard Evaluation Versus Non-Standard Evaluation in R. There is a lot of unnecessary worry over “Non Standard Evaluation” (NSE) in R versus “Standard Evaluation” (SE, or standard “variables names refer to values” evaluation). This very author is guilty of over-discussing the issue.
But let’s give this yet another try. Tidyeval Tutorial. Yet Another Introduction to tidyeval. Quoting and macros in R. The Roots of Quotation. About lazy evaluation. Dplyr NSE: Summarize and generate multiple variables in a loop. Tidy evaluation, most common actions. Tidy evaluation is a bit challenging to get your head around. Even after reading programming with dplyr several times, I still struggle when creating functions from time to time. I made a small summary of the most common actions I perform, so I don’t have to dig in the vignettes and on stackoverflow over and over. Each is accompanied with a minimal example on how to implement it. I thought others might find this useful too, so here it is in a blog post. Non-standard evaluation, how tidy eval builds on base R. As with many aspects of the tidyverse, its non-standard evaluation (NSE) implementation is not something entirely new, but built on top of base R. What makes this one so challenging to get your mind around, is that the Honorable Doctor Sir Lord General and friends brought concepts to the realm of the mortals that many of us had no, or only a vague, understanding of.
Earlier, I gave an overview of the most common actions in tidy eval. Here's what I know about tidyeval. Quote While the Promise Is Hot! Suppose we want to quote x when x is not NULL. The naive implementation would be like below. Here, y is for comparison. Overscoping and eval. Bang Bang - How to program with dplyr. The tidyverse is making the life of a data scientist a lot easier. Rlang 0.4 curly-curly. Practical Tidy Evaluation. Advanced Programming and NSE with dplyr. Filter when the condition is a string. Tidy eval now supports glue strings. Intro to 'apply' R tutorial on the Apply family of functions. Plyr - sapply vs. lapply vs. apply. vs. tapply vs. by vs. aggregate.
In R, extract part of object from list. Map instead of lapply? Running a model on separate groups. It's lists all the way down, part 2: We need to go deeper. Mapping a list of functions to a list of datasets with a list of columns as arguments. Repurrrsive: Recursive lists to use in teaching and examples. Happy dev with {purrr} Exploring purrr's Other Functions. Purrr for biostatisticians. Learn to purrr. Purrr beyond map. Handling errors using purrr's possibly() and safely() Food Markets in New York. Roomba: General purpose API response tidier. Slider 0.1.0. Flatxml: working with XML files as R dataframes. Jsontools: Helpers to work with JSON in R. Time Aware Tibbles.
Tidy Temporal Data Frames and Tools. Date Formats in R. Do more with dates and times in R with lubridate 1.1.0. Anytime – dates in R. FlipTime: Easily Convert Strings to Times and Dates. Working with dates and time in R using the lubridate package. Intro to Handling Date & Time in R. Almanac: Tools for Adjusting and Generating Dates Using a Grammar of Schedules. Clock: Comprehensive Date-Time Handling for R. Strategies for working with new data. Check Yo’ Data Before You Wreck Yo’ Results. Pointblank v0.3. Who you gonna call? R processes! Naniar: Expanding Tidy Data For Missing Data. Missingness of Temporal Data. Rvest: easy web scraping with R. R got good at scraping.
Global Peace Index: Web scraping and bump charts! Speeding Up Digital Arachnids. Bad Stock Photos of My Job? Data Science on Pexels. ALLSTATisticians in decline? A polite look at ALLSTAT email Archives. Robotstxt. Polite: Be nice on the web. In praise of Commonmark: wrangle (R)Markdown files without regex. Web Scraping Product Data in R with rvest and purrr.