
Social-Media-Demographics-800.png (PNG Image, 800 × 5116 pixels) Icons & Icon Packs - Download Free PNG Icons. Icon Search Engine. Tips, tricks and resources to make your own gorgeous infographics.
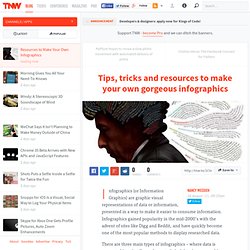
Infographics (or Information Graphics) are graphic visual representations of data or information, presented in a way to make it easier to consume information.

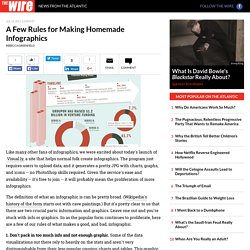
Infographics gained popularity in the mid-2000′s with the advent of sites like Digg and Reddit, and have quickly become one of the most popular methods to display researched data. There are three main types of infographics – where data is presented in a timeline, where statistical data is presented in graphs or with icons, or where data is presented on a map. Photo editor online / free image editing direct in your browser - Pixlr.com. Create infographics. Make Your Images Interactive - ThingLink. Piktochart. A Few Rules for Making Homemade Infographics. Like many other fans of infographics, we were excited about today's launch of Visual.ly, a site that helps normal folk create infographics.

The program just requires users to upload data, and it generates a pretty JPG with charts, graphs, and icons -- no PhotoShop skills required. Given the service's ease and availability -- it's free to join -- it will probably mean the proliferation of more infographics. Visualizations. Ideas, issues, knowledge, data - visualized! Infographics & Data Visualization. Juice Labs - Chart Chooser. DAYTUM. Fast Analytics and Rapid-fire Business Intelligence from Tableau Software. Create visualization.