
13 - Interactive Learning Tools. In Education: Community Events. Home - Google Science Fair 2014. For Education. Public Data Explorer. 3D for Everyone. 20 Things I Learned About Browsers and the Web. IllustrationChristoph Niemann Writers/EditorsMin Li Chan, Fritz Holznagel, Michael Krantz Project CuratorMin Li Chan & The Google Chrome Team DesignFiPaul Truong DevelopmentFi Very Special Thanks To Brian Rakowski, Ian Fette, Chris DiBona, Alex Russell, Erik Kay, Jim Roskind, Mike Belshe, Dimitri Glazkov, Henry Bridge, Gregor Hochmuth, Jeffrey Chang, Mark Larson, Aaron Boodman, Wieland Holfelder, Jochen Eisinger, Bernhard Bauer, Adam Barth, Cory Ferreria, Erik Arvidsson, John Abd-Malek, Carlos Pizano, Justin Schuh, Wan-Teh Chang, Vangelis Kokkevis, Mike Jazayeri, Brad Chen, Darin Fisher, Johanna Wittig, Maxim Lobanov, Marion Fabing Nicolas, Jana Vorechovska, Daniele De Santis, Laura van Nigtevegt, Wojtek Cyprys, Dudley Carr, Richard Rabbat, Ji Lee, Glen Murphy, Valdean Klump, Aaron Koblin, Paul Irish, John Fu, Chris Wright, Sarah Nahm, Christos Apartoglou, Meredith Papp, Eric Antonow, Eitan Bencuya, Jay Nancarrow, Ben Lee, Gina Weakley, Linus Upson, Sundar Pichai & The Google Chrome Team.

Collections - Google Cultural Institute. View and manage form responses - Drive Help. View responses Once you’ve created your form and sent it to recipients, you’re able to view the responses you’ve received in three different ways: as a summary of responses, in a separate spreadsheet, or as a downloaded CSV.
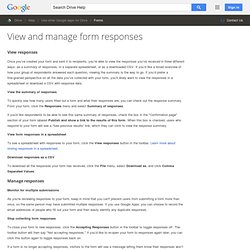
If you’d like a broad overview of how your group of respondents answered each question, viewing the summary is the way to go. If you’d prefer a fine-grained perspective on all the data you’ve collected with your form, you’ll likely want to view the responses in a spreadsheet or download a CSV with response data. View the summary of responses To quickly see how many users filled out a form and what their responses are, you can check out the response summary. If you'd like respondents to be able to see this same summary of responses, check the box in the "Confirmation page" section of your form labeled Publish and show a link to the results of this form. View form responses in a spreadsheet Download responses as a CSV Manage responses Monitor for multiple submissions. Overview - Welcome to Flubaroo. The grades created by Flubaroo will be located in an adjacent worksheet called "Grades", as shown: For each submission, Flubaroo will show which questions were answered correctly ("1" point"), which incorrectly ("0" points), and which were not graded.
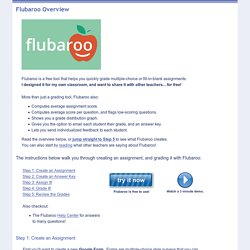
If less than 60% of students got a question correct, the question will be highlighted in orange to alert you. Additionally, students who scored less than 70% on the assignment will be highlighted in red. The Flubaroo menu will now offer you the ability to email each student their grades, view a summary report, or regrade the assignment. You might want to regrade the assignment if more students submitted answers, or if you want to throw out a question that most students got wrong. If you choose to email each student their grade, you'll be given the option to include an answer key in the email. Choosing "View Report" shows you a summary report of the grading. Want to try it out? Unleash Google Docs in Your Classroom: Student Use Starter Kit. 80+ Google Forms for the Classroom.
If you're new here, you may want to subscribe to my weekly newsletter.

Thanks for visiting! Google Forms is a great tool for the classroom and this post from 2008 has always proven popular on my blog. I hope you continue to be inspired by the ideas here. I have created example forms for each of the different topics, follow the links in each of the ten sections. 1 ) Get to know your class Use this form to gather some indication from your new class about their likes and dislikes, their favourite lessons or after school clubs they enjoy. 2 ) Emotion graph An emotion graph is a simple line graph comparing a range of happiness to sadness against different points (time) in a story or film. Apps for Education: Deployment Guide.
- StumbleUpon. Home.