
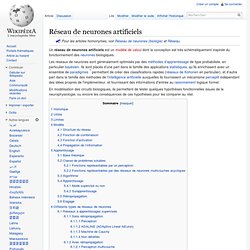
A Visual Introduction to Machine Learning. Finding better boundaries Let's revisit the 73-m elevation boundary proposed previously to see how we can improve upon our intuition.
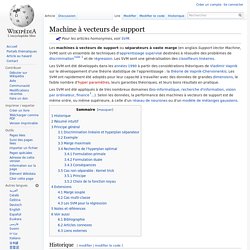
Clearly, this requires a different perspective. By transforming our visualization into a histogram, we can better see how frequently homes appear at each elevation. Apprentissage automatique. Apprentissage automatique Par l'entraînement, ici supervisé, sur un grand nombre de mesures, il devient facile à un programme d'apprentissage automatique de reconnaître des formes, même complexes, et d'y classifier ensuite de nouveaux points (exemple d'usage du programme mldemos).
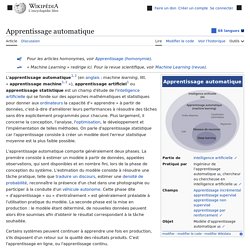
L'apprentissage automatique[1],[2] (en anglais : machine learning, litt. « apprentissage machine[1],[2] »), apprentissage artificiel[1] ou apprentissage statistique est un champ d'étude de l'intelligence artificielle qui se fonde sur des approches mathématiques et statistiques pour donner aux ordinateurs la capacité d'« apprendre » à partir de données, c'est-à-dire d'améliorer leurs performances à résoudre des tâches sans être explicitement programmés pour chacune. Plus largement, il concerne la conception, l'analyse, l'optimisation, le développement et l'implémentation de telles méthodes. L'apprentissage automatique comporte généralement deux phases. Apprentissage non supervisé. Un article de Wikipédia, l'encyclopédie libre.
Dans le domaine informatique, l'apprentissage non supervisé (parfois dénommé « clustering ») est une méthode d'apprentissage automatique. Il s'agit pour un logiciel de diviser un groupe hétérogène de données, en sous-groupes de manière que les données considérées comme les plus similaires soient associées au sein d'un groupe homogène et qu'au contraire les données considérées comme différentes se retrouvent dans d'autres groupes distincts ; l'objectif étant de permettre une extraction de connaissance organisée à partir de ces données. Variable aléatoire. En théorie des probabilités, une variable aléatoire est une application définie sur l'ensemble des éventualités, c'est-à-dire l'ensemble des résultats possibles d'une expérience aléatoire.
Ce furent les jeux de hasard qui amenèrent à concevoir les variables aléatoires, en associant à une éventualité (résultat du lancer d'un ou plusieurs dés, d'un tirage à pile ou face, d'une roulette, ...) un gain. Cette association éventualité-gain a donné lieu par la suite à la conception d'une fonction de portée plus générale.
Le développement des variables aléatoires est associé à la théorie de la mesure. Réseau de neurones artificiels. Un article de Wikipédia, l'encyclopédie libre.
Un réseau de neurones artificiels est un modèle de calcul dont la conception est très schématiquement inspirée du fonctionnement des neurones biologiques. Les réseaux de neurones sont généralement optimisés par des méthodes d’apprentissage de type probabiliste, en particulier bayésien. Ils sont placés d’une part dans la famille des applications statistiques, qu’ils enrichissent avec un ensemble de paradigmes [1] permettant de créer des classifications rapides (réseaux de Kohonen en particulier), et d’autre part dans la famille des méthodes de l’intelligence artificielle auxquelles ils fournissent un mécanisme perceptif indépendant des idées propres de l'implémenteur, et fournissant des informations d'entrée au raisonnement logique formel.
En modélisation des circuits biologiques, ils permettent de tester quelques hypothèses fonctionnelles issues de la neurophysiologie, ou encore les conséquences de ces hypothèses pour les comparer au réel. Machine à vecteurs de support. Un article de Wikipédia, l'encyclopédie libre.
Pour les articles homonymes, voir SVM. Les SVM ont été développés dans les années 1990 à partir des considérations théoriques de Vladimir Vapnik sur le développement d'une théorie statistique de l'apprentissage : la théorie de Vapnik-Chervonenkis. Les SVM ont rapidement été adoptés pour leur capacité à travailler avec des données de grandes dimensions, le faible nombre d'hyper paramètres, leurs garanties théoriques, et leurs bons résultats en pratique. Les SVM ont été appliqués à de très nombreux domaines (bio-informatique, recherche d'information, vision par ordinateur, finance[1]...). Régression (statistiques) Le terme provient de la régression vers la moyenne observée par Francis Galton au XIXe siècle : les enfants de personnes de grande taille avaient eux-mêmes une taille supérieure à celle de la population en moyenne, mais inférieure à celle de leurs parents (toujours en moyenne), sans que la dispersion de taille au sein de la population totale ne soit réduite pour autant[1],[2].
Les techniques développées pour quantifier ce phénomène ont engendré des outils de mesure précieux dans tous les champs d’application des statistiques. Apprentissage automatique. Classification automatique. Un article de Wikipédia, l'encyclopédie libre.
On appelle classification automatique la catégorisation algorithmique d'objets. Elle consiste à attribuer une classe ou catégorie à chaque objet (ou individu) à classer, en se basant sur des données statistiques. Elle fait couramment appel à l'apprentissage automatique et est largement utilisée en reconnaissance de formes. Apprentissage supervisé. Un article de Wikipédia, l'encyclopédie libre.
L'apprentissage supervisé (supervised learning en anglais) est une technique d'apprentissage automatique où l'on cherche à produire automatiquement des règles à partir d'une base de données d'apprentissage contenant des « exemples » (en général des cas déjà traités et validés). Analyse discriminante linéaire. Un article de Wikipédia, l'encyclopédie libre.
L’analyse discriminante linéaire fait partie des techniques d’analyse discriminante prédictive. Analyse discriminante. Un article de Wikipédia, l'encyclopédie libre. L’analyse factorielle discriminante ou analyse discriminante est une technique statistique qui vise à décrire, expliquer et prédire l’appartenance à des groupes prédéfinis (classes, modalités de la variable à prédire…) d’un ensemble d’observations (individus, exemples…) à partir d’une série de variables prédictives (descripteurs, variables exogènes…). L’analyse discriminante est utilisée dans de nombreux domaines. En médecine, par exemple pour détecter les groupes à hauts risques cardiaques à partir de caractéristiques telles que l’alimentation, le fait de fumer ou pas, les antécédents familiaux, etc.Dans le domaine bancaire, lorsque l’on veut évaluer la fiabilité d’un demandeur de crédit à partir de ses revenus, du nombre de personnes à charge, des encours de crédits qu’il détient, etc.En biologie, lorsque l’on veut affecter un objet à sa famille d’appartenance à partir de ses caractéristiques physiques.
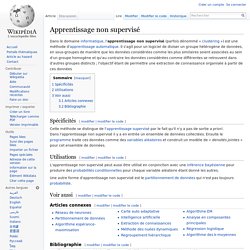
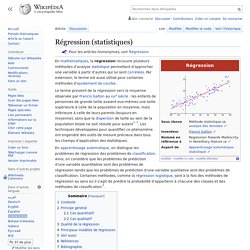
Observations décrites par groupes. Microsoft Azure Machine Learning Gallery. Machine learning : décryptage d'une technologie qui monte - JDN. Vente en ligne, recommandation de films, analyse de la consommation électrique, objets connectés... Les domaines d'application du machine learning sont nombreux. Décryptage. Le machine learning, qu'est-ce que c'est ? Machine learning : décryptage d'une technologie qui monte - JDN. Cluster analysis. The result of a cluster analysis shown as the coloring of the squares into three clusters. Cluster analysis or clustering is the task of grouping a set of objects in such a way that objects in the same group (called a cluster) are more similar (in some sense or another) to each other than to those in other groups (clusters).
It is a main task of exploratory data mining, and a common technique for statistical data analysis, used in many fields, including machine learning, pattern recognition, image analysis, information retrieval, and bioinformatics. Besides the term clustering, there are a number of terms with similar meanings, including automatic classification, numerical taxonomy, botryology (from Greek βότρυς "grape") and typological analysis. Linear separability. The problem of determining if a pair of sets is linearly separable and finding a separating hyperplane if they are arises in several areas.
In statistics and machine learning, classifying certain types of data is a problem for which good algorithms exist that are based on this concept. Mathematical definition[edit] Let. Regression analysis. Regression analysis is widely used for prediction and forecasting, where its use has substantial overlap with the field of machine learning. Regression analysis is also used to understand which among the independent variables are related to the dependent variable, and to explore the forms of these relationships. In restricted circumstances, regression analysis can be used to infer causal relationships between the independent and dependent variables.
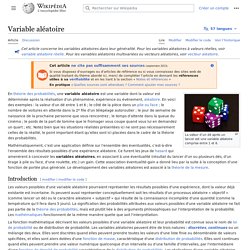
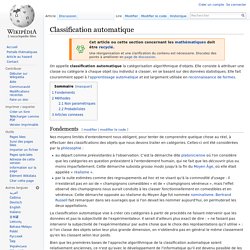
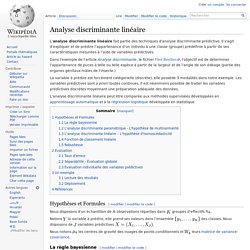
However this can lead to illusions or false relationships, so caution is advisable;[1] for example, correlation does not imply causation. Dimension (mathematics and physics) A diagram showing the first four spatial dimensions. 1-D: Two points A and B can be connected to a line, giving a new line segment AB. 2-D: Two parallel line segments AB and CD can be connected to become a square, with the corners marked as ABCD. 3-D: Two parallel squares ABCD and EFGH can be connected to become a cube, with the corners marked as ABCDEFGH. 4-D: Two parallel cubes ABCDEFGH and IJKLMNOP can be connected to become a hypercube, with the corners marked as ABCDEFGHIJKLMNOP.
In physical terms, dimension refers to the constituent structure of all space (cf. volume) and its position in time (perceived as a scalar dimension along the t-axis), as well as the spatial constitution of objects within—structures that correlate with both particle and field conceptions, interact according to relative properties of mass—and are fundamentally mathematical in description. The concept of dimension is not restricted to physical objects. Correlation does not imply causation. The counter assumption, that correlation proves causation, is considered a questionable cause logical fallacy in that two events occurring together are taken to have a cause-and-effect relationship. This fallacy is also known as cum hoc ergo propter hoc, Latin for "with this, therefore because of this", and "false cause". A similar fallacy, that an event that follows another was necessarily a consequence of the first event, is sometimes described as post hoc ergo propter hoc (Latin for "after this, therefore because of this").
Association rule learning. Association rule learning is a popular and well researched method for discovering interesting relations between variables in large databases. It is intended to identify strong rules discovered in databases using different measures of interestingness.[1] Based on the concept of strong rules, Rakesh Agrawal et al.[2] introduced association rules for discovering regularities between products in large-scale transaction data recorded by point-of-sale (POS) systems in supermarkets. For example, the rule found in the sales data of a supermarket would indicate that if a customer buys onions and potatoes together, they are likely to also buy hamburger meat.
Such information can be used as the basis for decisions about marketing activities such as, e.g., promotional pricing or product placements. Machine learning. Machine learning is a subfield of computer science[1] that evolved from the study of pattern recognition and computational learning theory in artificial intelligence.[1] Machine learning explores the construction and study of algorithms that can learn from and make predictions on data.[2] Such algorithms operate by building a model from example inputs in order to make data-driven predictions or decisions,[3]:2 rather than following strictly static program instructions.
Machine learning is closely related to and often overlaps with computational statistics; a discipline that also specializes in prediction-making. It has strong ties to mathematical optimization, which deliver methods, theory and application domains to the field. Machine learning is employed in a range of computing tasks where designing and programming explicit, rule-based algorithms is infeasible. Example applications include spam filtering, optical character recognition (OCR),[4] search engines and computer vision. Data mining. Data mining is the process of discovering patterns in large data sets involving methods at the intersection of machine learning, statistics, and database systems.[1] Data mining is an interdisciplinary subfield of computer science and statistics with an overall goal to extract information (with intelligent methods) from a data set and transform the information into a comprehensible structure for further use.[1][2][3][4] Data mining is the analysis step of the "knowledge discovery in databases" process or KDD.[5] Aside from the raw analysis step, it also involves database and data management aspects, data pre-processing, model and inference considerations, interestingness metrics, complexity considerations, post-processing of discovered structures, visualization, and online updating.[1] Etymology[edit]
Knowledge extraction. Knowledge extraction is the creation of knowledge from structured (relational databases, XML) and unstructured (text, documents, images) sources. The resulting knowledge needs to be in a machine-readable and machine-interpretable format and must represent knowledge in a manner that facilitates inferencing. Although it is methodically similar to information extraction (NLP) and ETL (data warehouse), the main criteria is that the extraction result goes beyond the creation of structured information or the transformation into a relational schema. It requires either the reuse of existing formal knowledge (reusing identifiers or ontologies) or the generation of a schema based on the source data. Overview[edit] Online machine learning. Online machine learning is used in the case where the data becomes available in a sequential fashion, in order to determine a mapping from the dataset to the corresponding labels.
The key difference between online learning and batch learning (or "offline" learning) techniques, is that in online learning the mapping is updated after the arrival of every new datapoint in a scalable fashion, whereas batch techniques are used when one has access to the entire training dataset at once. Online learning could be used in the case of a process occurring in time, for example the value of a stock given its history and other external factors, in which case the mapping updates as time goes on and we get more and more samples. Ideally in online learning, the memory needed to store the function remains constant even with added datapoints, since the solution computed at one step is updated when a new datapoint becomes available, after which that datapoint can then be discarded. , where.
Statistical classification. Grammar induction. There is now a rich literature on learning different types of grammar and automata, under various different learning models and using various different methodologies. Grammar Classes[edit] Grammatical inference has often been very focused on the problem of learning finite state machines of various types (see the article Induction of regular languages for details on these approaches), since there have been efficient algorithms for this problem since the 1980s. More recently these approaches have been extended to the problem of inference of context-free grammars and richer formalisms, such as multiple context-free grammars and parallel multiple context-free grammars. Other classes of grammars for which grammatical inference has been studied are contextual grammars, and pattern languages.
Stochastic. Computational statistics. Statistics algorithms were one of the first uses of modern computers. Anomaly detection. Supervised learning.