
Middleclass. October Economic Summary in Graphs. Here is a collection of real estate and economic graphs for data released in October ...

Note: Click on graphs for larger image in new window. For more info, click on link below graph to original post. New Home Sales in September (NSA) Information goes out to play. Serious information used to be relayed in words, graphs and charts - pictures were just pretty window dressing.
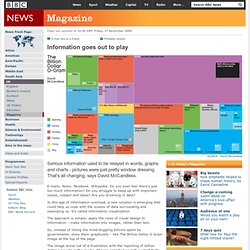
That's all changing, says David McCandless. E-mails. News. Facebook. The Billion Dollar Gram. How Long Will the World’s Natural Resources Last? This graphic from New Scientist shows when certain natural resources will run out in the world if we continue at the current consumption rate.

However, reader beware, this graphic feels more like eye candy than real data. I'm no ecologist, but something about these numbers doesn't seem quite right. Completely out of gold in the entire world in 45 years? No more indium (for LCDs) in 13 years? I don't quite get the comparison between world consumption rate vs half of the US consumption rate. Data Visualization and Statistics.