
Polymaps. Pack Layout · mbostock/d3 Wiki. Wiki ▸ API Reference ▸ Layouts ▸ Hierarchy ▸ Pack Layout Enclosure diagrams use containment (nesting) to represent the hierarchy.
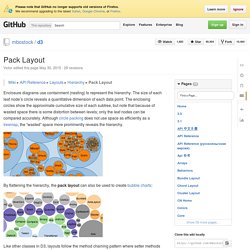
The size of each leaf node’s circle reveals a quantitative dimension of each data point. The enclosing circles show the approximate cumulative size of each subtree, but note that because of wasted space there is some distortion between levels; only the leaf nodes can be compared accurately. Although circle packing does not use space as efficiently as a treemap, the “wasted” space more prominently reveals the hierarchy. By flattening the hierarchy, the pack layout can also be used to create bubble charts: Rotating Icosahedron. Tools on Datavisualization.ch. A Carefully Selected List of Recommended Tools 07 May 2012 Tools Flash, JavaScript, Processing, R When I meet with people and talk about our work, I get asked a lot what technology we use to create interactive and dynamic data visualizations.

To help you get started, we have put together a selection of the tools we use the most and that we enjoy working with. Read more Pathline: Connecting Designers With Scientists 18 Apr 2012 Tools We recently attended an interdisciplinary visualization workshop that was all about creating a dialogue between scientists, technologists and designers. New Maps for the Web by Stamen 22 Mar 2012 Tools JavaScript, Mapping I just left the Stamen studio where I had a brief chat with founder and CEO Eric Rodenbeck. The Visualizing Player 19 Jul 2011 Showcases, Tools Visualizing.org launched their brand new Visualizing Player, a terrific tool for embedding interactive and static data visualizations. Working with Data in Protovis 17 Feb 2011 Tools JavaScript, Tutorial. Ghost Counties on Datavisualization.ch. Earlier this year, Visualizing.org and Eyeo made an open call for designers and developers to create an interactive portrait of America by visualizing the 2010 census data.

Jan Willem Tulp, a freelance information visualizer based in The Netherlands has recently published his submission for the competition called Ghost Counties. The visualization, developed in Processing, analyzes the numbers of homes and vacant homes in proportion to the population of all counties in the United States of America. The data itself was not very complex, but rather big, and the biggest challenge was to find a creative approach to visualize this data, but without using a map (which would be rather obvious since it’s about locations). The counties are represented by two concentric circles and the size of the outer bubble represents the total number of homes, the size of the inner bubble represents the number of vacant homes. The visualization achieves to clearly show exceptional states of counties. Arbor.js » echolalia. Paper.js — Tutorials. Unfolding Maps: Getting Started in Processing. Download Library Download the latest version of the Unfolding library.

Unzip the archive and put the extracted Unfolding folder into the libraries folder of your Processing sketches. To find the Processing sketches location on your computer, open the Preferences window of the Processing application and look for the “Sketchbook location” item at the top. You will need to create the “libraries” folder if this is your first contributed library. Restart Processing, start a new sketch and create your first simple map. Hello World To get started, you need to include the Unfolding library via Sketch » Import Library and put the import statements at the top of your code.
Create a reference to a “Map” object, i.e. Initialize a new map object and add the default event function for basic interaction (double-click to zoom and drag to pan the map). (You can specify P2D or P3D as renderer as the third parameter of the size() function, and Unfolding will use the appropriate one.) That’s it. Tips & Tricks. Tillnagel/unfolding. Datavisualization.ch Selected Tools. Facebook Users in Europe- OpenProcessing.