
Countries and Territories. Green Growth Knowledge Platform. Statutory Corporate Income Tax Rates. Copernicus Sentinel-5P Mapping Portal. Investor reporting guidance. Country Profiles — Climate-ADAPT. EEA Member countries are at different stages of preparing, developing and implementing national adaptation strategies and plans.
See in the map below the information provided by each Member State of the European Union under the European mechanism for monitoring and reporting information relevant to climate change (Regulation (EU) No 525/2013). For other EEA Member countries, the information provided is based on voluntary submissions to EEA. Resources. SDG Help Desk, by UNESCAP Sustainable Development Since the 1972 UN Conference on the Human Environment the reach of sustainable development governance has expanded considerably at local, national, regional and international levels.
The need for the integration of economic development, natural resources management and protection and social equity and inclusion was introduced for the first time by the 1987 Brundtland Report (Our Common Future), and was central in framing the discussions at the 1992 United Nations Conference on Environment and Development (UNCED) also known as the Earth Summit. Publications. Visual Capitalist. Burgen- & Schlösser-Ranking: Die beliebtesten Burgen und Schlösser 2020. Welche Burgen und Schlösser finden die Deutschen besonders toll?
EURACTIV.com – EU news and policy debates across languages. Transport Climate Action Directory. The Transport Climate Action Directory is an online database of transport CO2 reduction policy measures.
It contains more than 60 different mitigation measures along with the evidence-base needed to assess their effectiveness. It helps decision makers to translate their decarbonisation ambitions into actions and achieve their climate objectives. It provides them with a range of options that can deliver concrete decarbonisation outcomes for transport in their specific context. For ease of use, the directory presents decarbonisation measures for five different categories: Willkommen beim Klimanavigator. Questions relating to food consumers. IESBA Code of Ethics for Professional Accountants. The International Code of Ethics for Professional Accountants (including International Independence Standards) ("the Code") sets out fundamental principles of ethics for professional accountants, reflecting the profession's recognition of its public interest responsibility.
These principles establish the standard of behavior expected of a professional accountant. The fundamental principles are: integrity, objectivity, professional competence and due care, confidentiality, and professional behavior. Read More The Code provides a conceptual framework that professional accountants are to apply in order to identify, evaluate and address threats to compliance with the fundamental principles. The Code sets out requirements and application material on various topics to help accountants apply the conceptual framework to those topics. How the Code is Structured The Code contains the following material: Find your new business location in Tampere Region, Finland! WEPs GAT Tool - Home. Climate spirals. Effectively communicating climate change is a challenge.
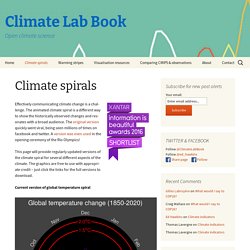
The animated climate spiral is a different way to show the historically observed changes and resonates with a broad audience. The original version quickly went viral, being seen millions of times on facebook and twitter. ESA - ESA Web TV. D-portal. Data - Organisation for Economic Co-operation and Development. Rising fossil fuel support poses a threat to building a healthier and climate-safe future OECD analysis of budgetary transfers, tax breaks and spending programmes linked to the production and use of coal, oil, gas and other petroleum products in 44 OECD and G20 economies showed that total fossil fuel support rose by 10% to USD 178 billion in 2019, ending a five-year downward trend.
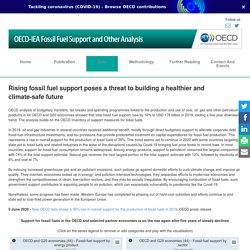
The analysis builds on the OECD Inventory of support measures for fossil fuels. In 2019, oil and gas industries in several countries received additional benefit, mostly through direct budgetary support to alleviate corporate debt, fossil-fuel infrastructure investments, and tax provisions that provide preferential treatment on capital expenditures for fossil-fuel production. This represents a rise in overall support for the production of fossil fuels of 38%. Nonetheless, some progress has been made. ≡ Allgemeinbildung verbessern: Schnell + Einfach in 340 Listen. Connect to Water Stewardship Projects Around the World. Climate Watch.
EuroBirdPortal - Home. LIVE maps show data from the previous day back to one year ago.
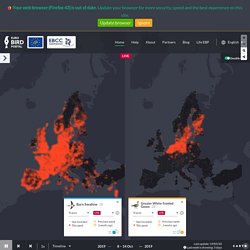
As in all other EBP maps data is grouped in 52 weeks. Despite most EBP data (86%) is updated daily some online portals still submit their data at longer intervals and, therefore, the areas covered by these portals can appear blank in the most recent weeks (see below which the most recent data available is from each online portal and the usual update frequency of each country or region). Note that the most recent week depicted in these maps, usually the current one, may not have finished yet and, thus, special attention must be paid when interpreting distributional patterns of such incomplete weeks. Note also that, despite the different data validation protocols put in place, LIVE maps show so recent data that some erroneous records or counts may not have been detected yet. Once corrected, the system automatically deals with these errors in subsequent data updates. Table of Contents - 2015-2020 Dietary Guidelines. Global Forest Watch.
Economist Intelligence Unit. Energy & Climate Intelligence Unit. ERGI. Center For Global Development. Plastic Bags Used Per Year - TheWorldCounts. 4 Charts Explain Greenhouse Gas Emissions by Countries and Sectors. Global annual greenhouse gas emissions have grown 41% since 1990, and they are still climbing.
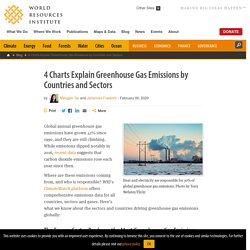
While emissions dipped notably in 2016, recent data suggests that carbon dioxide emissions rose each year since then. Where are these emissions coming from, and who is responsible? WRI’s ClimateWatch platform offers comprehensive emissions data for all countries, sectors and gases. Here’s what we know about the sectors and countries driving greenhouse gas emissions globally: The Energy Sector Produces the Most Greenhouse Gas Emissions Energy consumption is by far the biggest source of human-caused greenhouse gas emissions, responsible for a whopping 73% worldwide. A global screening tool by Climate Central. Services Trade. Services are a major part of the global economy, generating more than two-thirds of global gross domestic product (GDP), attracting over three-quarters of foreign direct investment in advanced economies, employing the most workers, and creating most new jobs globally.
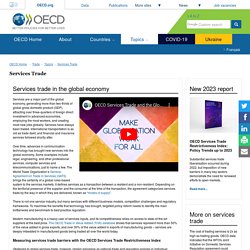
Services have always been traded. International transportation is as old as trade itself, and financial and insurance services followed shortly after. Over time, advances in communication technology has brought new services into the global economy. Some examples include legal, engineering, and other professional services, computer services and telecommunications, just to name a few.