
The top 20 data visualisation tools. Visual Understanding Environment. Data Visualization. 25 (Free) 3D Modeling Applications You Should Not Miss. 3D-modeling tools help turn individual ideas into beautiful models and prototypes for a variety of fields.
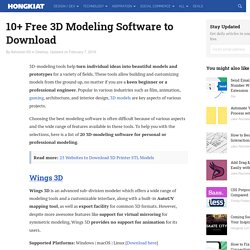
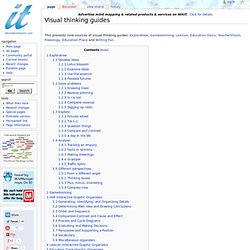
These tools allow building and customizing models from the ground up, no matter if you are a keen beginner or a professional engineer. Popular in various industries such as film, animation, gaming, architecture, and interior design, 3D models are key aspects of various projects. Choosing the best modeling software is often difficult because of various aspects and the wide range of features available in these tools. To help you with the selections, here is a list of 20 3D-modeling software for personal or professional modeling. Read more: 25 Websites to Download 3D Printer STL Models Wings 3D Wings 3D is an advanced sub-division modeler which offers a wide range of modeling tools and a customizable interface, along with a built-in AutoUV mapping tool, as well as export facility for common 3D formats. Supported Platforms: Windows | macOS | Linux [Download here] Daz Studio Open SCAD NaroCAD. Visual Thinking Evolution. A mind map is a diagram used to represent words, ideas, tasks, or other items linked to and arranged around a central key word or idea.

Especially in British English, the terms spidergram and spidergraph are more common,[1] but they can cause confusion with the term spider diagram used in mathematics and logic. Mind maps are used to generate, visualize, structure, and classify ideas, and as an aid to studying and organizing information, solving problems, making decisions, and writing. The elements of a given mind map are arranged intuitively according to the importance of the concepts, and are classified into groupings, branches, or areas, with the goal of representing semantic or other connections between portions of information. Mind maps may also aid recall of existing memories.
By presenting ideas in a radial, graphical, non-linear manner, mind maps encourage a brainstorming approach to planning and organizational tasks. Reference: wikipedia. Data Visualization: Modern Approaches. About The Author Vitaly Friedman loves beautiful content and doesn’t like to give in easily. When he is not writing or speaking at a conference, he’s most probably running … More about Vitaly Friedman … Data presentation can be beautiful, elegant and descriptive.
There is a variety of conventional ways to visualize data - tables, histograms, pie charts and bar graphs are being used every day, in every project and on every possible occasion. However, to convey a message to your readers effectively, sometimes you need more than just a simple pie chart of your results. Data presentation can be beautiful, elegant and descriptive. So what can we expect? Let’s take a look at the most interesting modern approaches to data visualization as well as related articles, resources and tools. 1. Trendmap 2007 Informationarchitects.jp presents the 200 most successful websites on the web, ordered by category, proximity, success, popularity and perspective in a mindmap.
Visualisation tools resource list, Anthony Judge and Nadia McLaren. Visual thinking guides. This presents nine sources of visual thinking guides: Exploratree, Gamestorming, LexIcon, Education Oasis, TeacherVision, Freeology, Education Place and Writing Fun.
Exploratree hosts a set of interactive thinking guides. This is a free web resource where you can use the guides, print them, edit them or make your own. You can share them and work on them in groups. It is aimed at schools and students, but has ideas for thinkers of all ages. Interactive map: Flash (recommended) PDF (problem?) Here are some of the overall categories, names of individual diagram type and an indication of their purposes. Click the thumbnail to see a full-size image. Develop ideas Solve problems Explore Analyse Different perspectives Gamestorming presents thinking patterns as games, many of them visual, that will help to make meetings and discussions more fruitful and stimulating. $ - $100 Test 3 - 3-12-3 Brainstorm 4 - 4Cs 7 - 7Ps Framework A - Affinity Map; Air Time Mastermind; Argument map; Atomize R - Random Inputs.
All software. GGobi data visualization system. Presentazioni Efficaci. Diagrams. Les paradigmes de représentation. La guida in italiano a Prezi « Presentazioni Efficaci.