
Meerkat. Fact Sheet Meerkat is a social network analysis application under development by Dr.
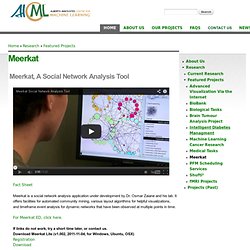
Osmar Zaiane and his lab. It offers facilities for automated community mining, various layout algorithms for helpful visualizations, and timeframe event analysis for dynamic networks that have been observed at multiple points in time. Techniques and Tools: How To Visualize Your Network. Earlier this month I was lucky enough to attend the CATechFest in LA designed and expertly facilitated by Aspiration.
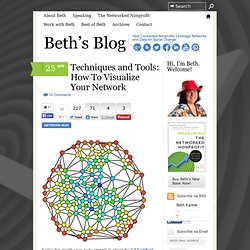
What I really enjoy about events that Aspiration convenes is that they allow the time and depth for practitioners to share knowledge and strengthen connections. The participants are the content – and the design of getting participants into small group discussions where we can discuss topics related to our work that we are passionate about and want to explore and learn. These discussions are not lectures or traditional panels and are participant driven. Ari Sahagun, a consultant who works with social justice groups on network visualizations, called for a group to discuss Network Mapping and Visualization. Introduction to Social Network Methods: Table of Contents. Robert A.
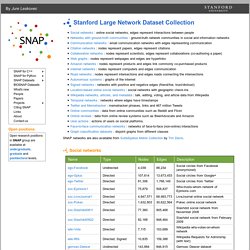
Hanneman and Mark Riddle Introduction to social network methods Table of contents About this book This on-line textbook introduces many of the basics of formal approaches to the analysis of social networks. You are invited to use and redistribute this text freely -- but please acknowledge the source. Hanneman, Robert A. and Mark Riddle. 2005. JoSS: Journal of Social Structure. Large Network Dataset Collection. Social networks Networks with ground-truth communities Communication networks Citation networks Collaboration networks Web graphs.
DM (2008) The application of network analysis to ancient transport geography: A case study of Roman Baetica. [ Return to Navigation] Introduction § 1 In many ways the Roman province of Baetica is an ideal subject for exploring new approaches to historic transport geography.
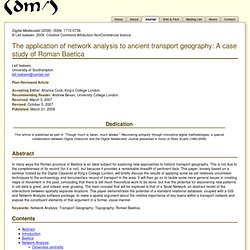
This is not due to the completeness of its record (for it is not), but because it provides a remarkable breadth of pertinent data (Sillières 1990, 9-16). This paper, loosely based on a seminar hosted by the Digital Classicist at King’s College London, will briefly discuss the results of applying some as-yet relatively uncommon techniques to the archaeology and documentary record of transport in the area. It will then go on to tackle some more general issues in creating maps of movement in the past, concluding that there is still much theoretical work to be done, but that the potential for discovering new patterns in old data is great, and indeed, ever growing. § 2 The main concept that will be explored is that of a Node Network, an abstract model of the interactions between spatially separate locations. Baetica. Datasets - Gephi:Wiki. Gephi sample datasets, in various format (GEXF, GDF, GML, NET, GraphML, DL, DOT).
Feel free to add new datasets. Be sure you cite original authors. Supported graph formats are described here. Note that Gephi can open these files without the need to be unzipped. Web and Internet [GEXF] EuroSiS web mapping study: Mapping interactions between Science in Society actors on the Web of 12 European countries. [GML] Internet: a symmetrized snapshot of the structure of the Internet at the level of autonomous systems, reconstructed from BGP tables posted by the University of Oregon Route Views Project. Get Your Data into Gephi: A Quick and Basic Tutorial.
If you’re interested in learning more about information visualization by trying out some yourself, here’s a quick tutorial on how to get a very basic dataset showing character relationships from a piece of literature into Gephi!
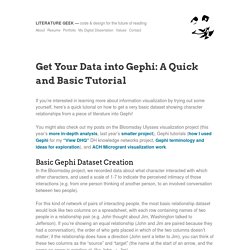
You might also check out my posts on the Bloomsday Ulysses visualization project (this year’s more in-depth analysis, last year’s smaller project), Gephi tutorials (how I used Gephi for my “View DHQ” DH knowledge networks project, Gephi terminology and ideas for exploration), and ACH Microgrant visualization work. Basic Gephi Dataset Creation In the Bloomsday project, we recorded data about what character interacted with which other characters, and used a scale of 1-7 to indicate the perceived intimacy of those interactions (e.g. from one person thinking of another person, to an involved conversation between two people). Data Visualization Software. SocNetV - Social Networks Visualization and Analysis Software. Link Graph Visualization. Walrus - Graph Visualization Tool. Source Code Available The source code to Walrus is now available under the GNU GPL.

You may download the source code below. Description Walrus is a tool for interactively visualizing large directed graphs in three-dimensional space. SoNIA - Social Network Image Animator. Social Network Image Animator What is it?
SoNIA is a Java-based package for visualizing dynamic or longitudinal "network" data. By dynamic, we mean that in addition to information about the relations (ties) between various entities (actors, nodes) there is also information about when these relations occur, or at least the relative order in which they occur. Our intention for SoNIA is to read-in dynamic network information from various formats, aid the user in constructing "meaningful" layouts, and export the resulting images or "movies" of the network, along with information about the techniques and parameter settings used to construct the layouts, and some form of statistic indicating the "accuracy" or degree of distortion present in the layout.
This is all somewhat ambitious, but not impossible. Complex Adaptive Systems Modeling - a SpringerOpen journal. Social Networks - ScienceDirect.com. Mapping the Austrian Political Twittersphere. Mapping the Austrian Political Twittersphere How politicians, journalists and political strategists (inter-)act on Twitter Axel Maireder*, Julian Ausserhofer** & Axel Kittenberger*** * University of Vienna, Department of Communication, axel.maireder@univie.ac.at** FH Joanneum, Department of Journalism and Public Relations, julian.ausserhofer@fh-joanneum.at*** University of Vienna, axel.kittenberger@univie.ac.at Abstract:
Using Netvizz & Gephi to Analyze a Facebook Network. This post was originally featured on published on May 6th, 2010.
Since the website will be relaunched and the post removed, I have relocated the tutorial to my personal page so that the Gephi community can continue to benefit from it. If a picture is worth a thousand words, then a graph must be worth a thousand spreadsheet rows, right? Social Network Analysis (SNA) Software Review. So you want to make your own network graphs and do your own network analysis, and you are looking for some software in which to do it?
ANI has used a lot of them, and what follows is our review to help you make the right choice for your project. Network analysis software fall into two categories – standalone GUI-based programs and command-line (CMD) software library packages to be used with other programming languages. Gephi - Dynamic demo. UWGB Commons for the Digital and Public Humanities. “Gephi is an open-source software for visualizing and analysing large networks graphs. Gephi uses a 3D render engine to display graphs in real-time and speed up the exploration. You can use it to explore, analyse, spatialise, filter, cluterize, manipulate and export all types of graphs.” Gephi is a program downloaded from the internet, and can be found here. First your group should decide what instances/variable/interactions you will be collecting information about. This could be who talks to who in the novel, who directly interacts with each other, or who as a character is given direct speech rather than internal dialogue.
For example, Character A initiates a conversation with Character B, making this “edge” a directed one. Once you have your data collected you can put it in an Excel Spreadsheet so that you can keep the data incase you ever need to use it, or alter the data that is being placed into the Gephi Data Lab. Free Tools to Visualize Your Data. Data visualization has grown in popularity as datasets have become larger and tools have become more user-friendly. This area is eagerly being explored by researchers in a variety of disciplines. Although many people think of numbers when they consider types of data, data comes in many forms–including text! In fact, for many researchers, especially those in the humanities or social sciences, text is their primary data source. This example of a network visualization could be created using a tool like Gephi or Sci2. Image: Clickstream Data Yields High-Resolution Maps of Science.
Complex Adaptive Systems Modeling - a SpringerOpen journal. Tools - WikiViz. Social Network Analysis: A Systematic Approach for Investigating. Social network analysis (SNA) is often confused with social networking sites, such as Facebook, when in fact, SNA is an analytical tool that can be used to map and measure social relations. Through quantitative metrics and robust visual displays, police can use SNA to discover, analyze, and visualize the social networks of criminal suspects.
SNA, a social science methodology, serves as a valuable tool for law enforcement. While technologically sophisticated, SNA proves easy to employ. Using available data, police departments structure the examination of an offender’s social network in ways not previously possible. Introduction to Network Visualization with GEPHI. New tutorial available! WikiViz. ParaView. UCINET Software. Cytoscape: Hands-down Winner for Large-scale Graph Visualization. Link Graph Visualization. VOSviewer. Learn how to use Gephi. Spheres. Spheres [ english | español | portugués ] Text Network Analysis.
Text network analysis allows one to quickly visualize the meanings and agendas present within a text, live conversation, broadcast, or interview. Networks / Pajek. A visual exploration on mapping complex networks. Start [Pajek Wiki] Data Visualization Software. Welcome to igraph's new home. June 24, 2015 Release Notes. SocNetV - Social Networks Visualization and Analysis Software. An Open Source Platform for Complex Network Analysis and Visualization. GraphChi. NodeXL: Network Overview, Discovery and Exploration for Excel - Home. Social Network Analysis. About the Course Everything is connected: people, information, events and places, all the more so with the advent of online social media. Simulation software for Complex Adaptive Systems. Software for Demonstrating Complex Adaptive Systems Professor Robert GoldstoneIndiana UniversityDepartment of PsychologyProgram in Cognitive SciencePercepts and Concepts Laboratoryrgoldsto@indiana.edu I have developed several computer simulations for an undergraduate course I teach at Indiana University called "Complex Adaptive Systems.
" The course deals with systems that evolve and adapt over time.