
Clustering: A Survey. 2.3. Clustering — scikit-learn 0.15.2 documentation. Clustering of unlabeled data can be performed with the module sklearn.cluster.
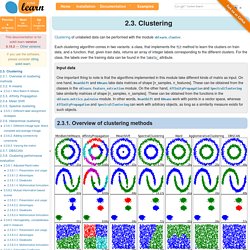
Each clustering algorithm comes in two variants: a class, that implements the fit method to learn the clusters on train data, and a function, that, given train data, returns an array of integer labels corresponding to the different clusters. For the class, the labels over the training data can be found in the labels_ attribute. 2.3.1. Overview of clustering methods A comparison of the clustering algorithms in scikit-learn Non-flat geometry clustering is useful when the clusters have a specific shape, i.e. a non-flat manifold, and the standard euclidean distance is not the right metric. Gaussian mixture models, useful for clustering, are described in another chapter of the documentation dedicated to mixture models.
OPTICS-Automatic-Clustering/AutomaticClustering.py at master · amyxzhang/OPTICS-Automatic-Clustering. OPTICS clustering in Python. OPTICS-Automatic-Clustering/OpticsClusterArea.py at master · amyxzhang/OPTICS-Automatic-Clustering. [] Scipy.cluster.vq.kmeans — SciPy v0.14.0 Reference Guide. Scipy.cluster.vq.kmeans — SciPy v0.14.0 Reference Guide. Step-By-Step K-Means Example. As a simple illustration of a k-means algorithm, consider the following data set consisting of the scores of two variables on each of seven individuals: This data set is to be grouped into two clusters.
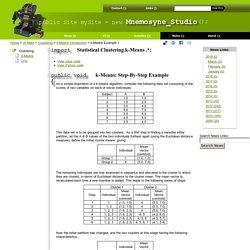
As a first step in finding a sensible initial partition, let the A & B values of the two individuals furthest apart (using the Euclidean distance measure), define the initial cluster means, giving: The remaining individuals are now examined in sequence and allocated to the cluster to which they are closest, in terms of Euclidean distance to the cluster mean. The mean vector is recalculated each time a new member is added. This leads to the following series of steps: Now the initial partition has changed, and the two clusters at this stage having the following characteristics: But we cannot yet be sure that each individual has been assigned to the right cluster. Only individual 3 is nearer to the mean of the opposite cluster (Cluster 2) than its own (Cluster 1). Python - Kmeans with Spark. Machine Learning Library (MLlib) - Spark 0.9.1 Documentation. MLlib is a Spark implementation of some common machine learning (ML) functionality, as well associated tests and data generators.
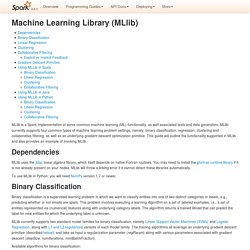
MLlib currently supports four common types of machine learning problem settings, namely, binary classification, regression, clustering and collaborative filtering, as well as an underlying gradient descent optimization primitive. This guide will outline the functionality supported in MLlib and also provides an example of invoking MLlib. MLlib uses the jblas linear algebra library, which itself depends on native Fortran routines. You may need to install the gfortran runtime library if it is not already present on your nodes. Spark/kmeans.py at master · apache/spark. K-means clustering and vector quantization (scipy.cluster.vq) — SciPy v0.14.0 Reference Guide.
Provides routines for k-means clustering, generating code books from k-means models, and quantizing vectors by comparing them with centroids in a code book.
The k-means algorithm takes as input the number of clusters to generate, k, and a set of observation vectors to cluster. It returns a set of centroids, one for each of the k clusters. An observation vector is classified with the cluster number or centroid index of the centroid closest to it. A vector v belongs to cluster i if it is closer to centroid i than any other centroids. If v belongs to i, we say centroid i is the dominating centroid of v. Mahout: Scalable machine learning and data mining. Canopy Clustering is a very simple, fast and surprisingly accurate method for grouping objects into clusters.
All objects are represented as a point in a multidimensional feature space. The algorithm uses a fast approximate distance metric and two distance thresholds T1 > T2 for processing. The basic algorithm is to begin with a set of points and remove one at random. Create a Canopy containing this point and iterate through the remainder of the point set. At each point, if its distance from the first point is < T1, then add the point to the cluster. Mahout: Scalable machine learning and data mining.
K-Means is a simple but well-known algorithm for grouping objects, clustering.
All objects need to be represented as a set of numerical features. In addition, the user has to specify the number of groups (referred to as k) she wishes to identify. Each object can be thought of as being represented by some feature vector in an n dimensional space, n being the number of all features used to describe the objects to cluster. The algorithm then randomly chooses k points in that vector space, these point serve as the initial centers of the clusters. Afterwards all objects are each assigned to the center they are closest to. After that, for each cluster a new center is computed by averaging the feature vectors of all objects assigned to it. Several tweaks concerning distance measure, initial center choice and computation of new average centers have been explored, as well as the estimation of the number of clusters k.
Quickstart Implementation. Introducing Apache Mahout. Scalable, commercial-friendly machine learning for building intelligent applications Grant IngersollPublished on September 08, 2009 Increasingly, the success of companies and individuals in the information age depends on how quickly and efficiently they turn vast amounts of data into actionable information.
Whether it's for processing hundreds or thousands of personal e-mail messages a day or divining user intent from petabytes of weblogs, the need for tools that can organize and enhance data has never been greater. Therein lies the premise and the promise of the field of machine learning and the project this article introduces: Apache Mahout (see Related topics).
Clustering de données - Détection de données anormales à l'aide du clustering k-Means. Réfléchissez un instant au problème de l'identification d'anomalies dans de très grands ensembles de données, par exemple, l'identification de transactions de cartes de crédit potentiellement frauduleuses, les demandes de prêt trop risquées, etc.
Une des approches possibles de la détection de données anormales est de grouper les éléments de données en clusters similaires et de rechercher à l'intérieur d'un cluster les éléments de données qui sont, d'une façon ou d'une autre, différents des autres éléments du cluster. Data Mining et Data Science. Cette page recense les supports utilisés pour mes enseignements de Machine Learning, Data Mining et de Data Science au sein du Département Informatique et Statistique (DIS) de l'Université Lyon 2, principalement en Master 2 Statistique et Informatique pour la Science des donnéEs (SISE), formation en data science, dans le cadre du traitement statistique des données et de la valorisation des big data.
Je suis très attentif à la synergie forte entre l'informatique et les statistiques dans ce diplôme, ce sont là les piliers essentiels du métier de data scientist. Attention, pour la majorité, il s'agit de « slides » imprimés en PDF, donc très peu formalisés, ils mettent avant tout l'accent sur le fil directeur du domaine étudié et recensent les points importants. Cette page est bien entendu ouverte à tous les statisticiens, data miner et data scientist, étudiants ou pas, de l'Université Lyon 2 ou d'ailleurs.