
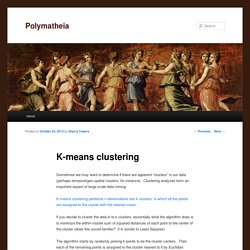
Identifying the number of clusters: finally a solution. Here I propose a solution that can be automated and does not require visual inspection by a human being.
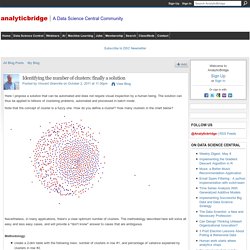
The solution can thus be applied to billions of clustering problems, automated and processed in batch mode. Note that the concept of cluster is a fuzzy one. How do you define a cluster? How many clusters in the chart below? Nevertheless, in many applications, there's a clear optimum number of clusters. Self study - Silhouette coefficients after deleting some data and re-clustering - Cross Validated. K modes clustering : how to choose the number of clusters? 1.11. Feature selection. The classes in the sklearn.feature_selection module can be used for feature selection/dimensionality reduction on sample sets, either to improve estimators’ accuracy scores or to boost their performance on very high-dimensional datasets. 1.13.1.
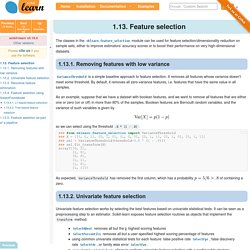
Removing features with low variance VarianceThreshold is a simple baseline approach to feature selection. It removes all features whose variance doesn’t meet some threshold. By default, it removes all zero-variance features, i.e. features that have the same value in all samples. As an example, suppose that we have a dataset with boolean features, and we want to remove all features that are either one or zero (on or off) in more than 80% of the samples.
So we can select using the threshold .8 * (1 - .8): As expected, VarianceThreshold has removed the first column, which has a probability. Seven Techniques for Data Dimensionality Reduction. By Rosaria Silipo.
The recent explosion of data set size, in number of records and attributes, has triggered the development of a number of big data platforms as well as parallel data analytics algorithms. At the same time though, it has pushed for usage of data dimensionality reduction procedures. Indeed, more is not always better. Beginners Guide To Learn Dimension Reduction Techniques. Introduction Brevity is the soul of wit This powerful quote by William Shakespeare applies well to techniques used in data science & analytics as well.
Intrigued ? Allow me to prove it using a short story. Medoid. Medoids are representative objects of a data set or a cluster with a data set whose average dissimilarity to all the objects in the cluster is minimal.[1] Medoids are similar in concept to means or centroids, but medoids are always members of the data set.
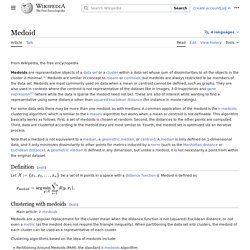
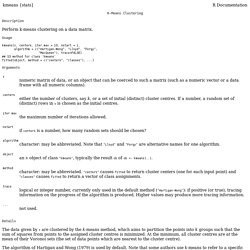
Medoids are most commonly used on data when a mean or centroid cannot be defined such as 3-D trajectories or in the gene expression context.[2] The term is used in computer science in data clustering algorithms. R: K-Means Clustering. Description.
Akaike's Information Criterion for estimated model - MATLAB aic - MathWorks Deutschland. DomainRedirect.html?uri= What are newsgroups?
The newsgroups are a worldwide forum that is open to everyone. Newsgroups are used to discuss a huge range of topics, make announcements, and trade files. Cluster analysis - How to calculate BIC for k-means clustering in R. K-means clustering. Sometimes we may want to determine if there are apparent “clusters” in our data (perhaps temporal/geo-spatial clusters, for instance).
Clustering analyses form an important aspect of large scale data-mining. K-means clustering partitions n observations into k clusters, in which all the points are assigned to the cluster with the nearest mean. If you decide to cluster the data in to k clusters, essentially what the algorithm does is to minimize the within-cluster sum of squared distances of each point to the center of the cluster (does this sound familiar? It is similar to Least Squares). The algorithm starts by randomly picking k points to be the cluster centers. Clustering - K-means incoherent behaviour choosing K with Elbow method, BIC, variance explained and silhouette - Data Science Stack Exchange. I'm trying to cluster some vectors with 90 features with K-means.
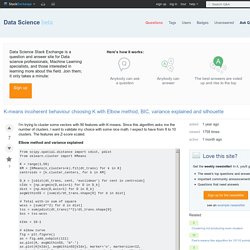
Since this algorithm asks me the number of clusters, I want to validate my choice with some nice math. I expect to have from 8 to 10 clusters. The features are Z-score scaled. Elbow method and variance explained From these two pictures, it seems that the number of clusters never stops :D. Bayesian information criterion This methods comes directly from X-means and uses the BIC to choose the number of clusters. another ref Same problem here... A Probabilistic Comparison of Commonly Used Interest Measures for Association Rules. A Probabilistic Comparison of Commonly Used Interest Measures for Association Rules > Research on Association Rules This page contains a collection of commonly used measures of significance and interestingness for association rules and itemsets.
All measures discussed on this page are implemented in the freely available R-extension package arules. Please contact me for corrections or if a measure is missing (on this page or implemented in arules). This work is licensed under the Creative Commons Attribution 4.0 International License. Introduction to Market Basket Analysis » Loren on the Art of MATLAB. You probably heard about the "beer and diapers" story as the often quoted example of what data mining can achieve.
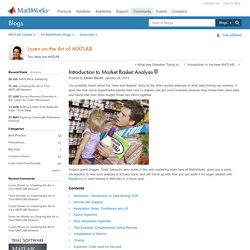
It goes like this: some supermarket placed beer next to diapers and got more business because they mined their sales data and found that men often bought those two items together. Today's guest blogger, Toshi Takeuchi, who works in the web marketing team here at MathWorks, gives you a quick introduction to how such analysis is actually done, and will follow up with how you can scale it for larger dataset with MapReduce (new feature in R2014b) in a future post. Contents Motivation: "Introduction to Data Mining" PDF I have been interested in Market Basket Analysis not because I work at a supermarket but because it can be used for web usage pattern mining among many applications. Let's start by loading the example dataset used in the textbook. Itemset and Support. GitHub - toshiakit/apriori: Market Basket Analysis with MATLAB. EDA MCA. Categorical variable. Categorical data is the statistical data type consisting of categorical variables or of data that has been converted into that form, for example as grouped data.
More specifically, categorical data may derive from either or both of observations made of qualitative data, where the observations are summarised as counts or cross tabulations, or of quantitative data, where observations might be directly observed counts of events happening or might be counts of values that occur within given intervals. Often, purely categorical data are summarised in the form of a contingency table. However, particularly when considering data analysis, it is common to use the term "categorical data" to apply to data sets that, while containing some categorical variables, may also contain non-categorical variables.
Notation Note that this ignores the concept of alphabetical order, which is a property that is not inherent in the names themselves, but in the way we construct the labels. Unsupervised learning - SOM clustering for nominal/circular variables. The use of Self-Organizing Maps in Recommender Systems. Self organised maps for binary data-is right choice? - ResearchGate.
SOM Toolbox: implementation of the algorithm. On this page, the structure of SOM and the SOM algorithm are described. The indented paragraphs give further details of the implementation in SOM Toolbox.In SOM Toolbox, all information regarding a SOM is gathered in a map struct. This struct has a number of fields, including the map codebook, map topology, component names and training history. There are also other structs, for example topology and training structs. Clustering in Matlab. What is a good clustering algorithm on hybrid dataset composed of both numerical and categorical data? - ResearchGate. K-Means clustering for mixed numeric and categorical data - Data Science Stack Exchange. The standard k-means algorithm isn't directly applicable to categorical data, for various reasons. The sample space for categorical data is discrete, and doesn't have a natural origin. A Euclidean distance function on such a space isn't really meaningful.
As someone put it, "The fact a snake possesses neither wheels nor legs allows us to say nothing about the relative value of wheels and legs. " What is the difference between categorical, ordinal and interval variables? What is the difference between categorical, ordinal and interval variables? In talking about variables, sometimes you hear variables being described as categorical (or sometimes nominal), or ordinal, or interval. Below we will define these terms and explain why they are important. Categorical A categorical variable (sometimes called a nominal variable) is one that has two or more categories, but there is no intrinsic ordering to the categories. For example, gender is a categorical variable having two categories (male and female) and there is no intrinsic ordering to the categories.
Ordinal. Self organised maps for binary data-is right choice? - ResearchGate. Untitled. Latente Klassenanalyse. Die latente Klassenanalyse (engl. Latent Class Analysis, LCA) ist ein Klassifikationsverfahren, mit dem beobachtbare diskrete Variablen zu latenten Variablen zugeordnet werden können. Sie basiert auf einem speziellen Latenten Variablenmodell, bei dem die manifesten und die latenten Variablen kategorial und nicht metrisch sind. Man spricht von latenten Klassen, weil es sich um diskrete latente Variablen handelt. Die latente Klassenanalyse ist ein spezieller Typ eines Strukturgleichungsmodells. Es wird verwendet, um Gruppen oder Untergruppen von Fällen bei multivariaten kategorialen Daten aufzuspüren. Die latente Klassenanalyse ist klassischen clusteranalytischen Verfahren überlegen, insbesondere, falls nur wenige beobachtete Eigenschaften oder Eigenschaftsausprägungen vorliegen.
Latent Class Analysis Software. MLLSA (Maximum Likelihood Latent Structure Analysis), written by the late Clifford Clogg, is a bit old but still a good way to learn LCA. Download an earlier PC version of MLLSA; mllsa.zip (44k bytes; zipped with PKZIP) contains executable code, sample input/output files, and abbreviated instructions for use. Fuller instructions are given in an Appendix to Allan McCutcheon's (1987) monograph from Sage Publications. Latent Class Analysis Frequently Asked Questions (FAQ) Basic Questions Intermediate Questions Advanced Questions Back to LCA main page. Latent Class Analysis Frequently Asked Questions (FAQ) Maeb7.pdf. Hierarchical Clustering 1: K-means. Technical Course: Cluster Analysis: K-Means Algorithm for Clustering. Clustering (2): Hierarchical Agglomerative Clustering. Iris Flower Clustering with Neural Net Clustering App. Kohonen-self-organizing-maps-shyam-guthikonda.pdf. Kohonen Network - Background Information.
The following short survey on Kohonen maps is not intended to be an extensive introduction to this technology. It rather presents a very short abstract of the algorithm involved. More details can be found in the literature. The Kohonen network (or "self-organizing map", or SOM, for short) has been developed by Teuvo Kohonen. The basic idea behind the Kohonen network is to setup a structure of interconnected processing units ("neurons") which compete for the signal. While the structure of the map may be quite arbitrary, this package supports only rectangular and linear maps. The SOM defines a mapping from the input data space spanned by x1..xn onto a one- or two-dimensional array of nodes. Each node of the map is defined by a vector wij whose elements are adjusted during the training.
The amount of adjustment in step 3 as well as the range of the neighborhood decreases during the training. The Kohonen map reflects the inner structure of the training data. l16.pdf. SOM tutorial part 1. Principal Component Analysis 4 Dummies: Eigenvectors, Eigenvalues and Dimension Reduction. K-means Clustering in Matlab.