
Conduct and Interpret a Cluster Analysis - Statistics Solutions. The Cluster Analysis is often part of the sequence of analyses of factor analysis, cluster analysis, and finally, discriminant analysis.
First, a factor analysis that reduces the dimensions and therefore the number of variables makes it easier to run the cluster analysis. Also, the factor analysis minimizes multicollinearity effects. The next analysis is the cluster analysis, which identifies the grouping. Lastly, a discriminant analysis checks the goodness of fit of the model that the cluster analysis found and profiles the clusters.
In almost all analyses a discriminant analysis follows a cluster analysis because the cluster analysis does not have any goodness of fit measures or tests of significance. Typical research questions the Cluster Analysis answers are as follows: Medicine – What are the diagnostic clusters? Other techniques you might want to try in order to identify similar groups of observations are Q-analysis, multi-dimensional scaling (MDS), and latent class analysis. A Bayesian Multidimensional Scaling Model for Partial Rank Preference Data - Academic Commons.
Title: A Bayesian Multidimensional Scaling Model for Partial Rank Preference Data Author(s): Tanaka, Kyoko Thesis Advisor(s): Johnson, Matthew Date: Type: Dissertations Department: Measurement and Evaluation Permanent URL: Notes: Ph.D., Columbia University.
Abstract: There has been great advancement on research for preferential choice in field of marketing. Subject(s): Quantitative psychology and psychometrics Item views: Metadata: text | xml. Clustering - Classification after factor analysis. Does it make sense to perform Principal Components Analysis (PCA) before clustering, if the original data has too many dimensions? Spectral Clustering: A quick overview. A lot of my ideas about Machine Learning come from Quantum Mechanical Perturbation Theory.

To provide some context, we need to step back and understand that the familiar techniques of Machine Learning, like Spectral Clustering, are, in fact, nearly identical to Quantum Mechanical Spectroscopy. As usual, this will take several blogs. Here, I give a brief tutorial on the theory of Spectral Clustering and how it is implemented in open source packaages At some point I will rewrite some of this and add a review of this recent paper Robust and Scalable Graph-Based Semisupervised Learning Spectral (or Subspace) Clustering The goal of spectral clustering is to cluster data that is connected but not lnecessarily compact or clustered within convex boundaries The basic idea: Sounds simple enough. Affinities and Similarities What is an Affinity? Given 2 data points (projected in ), we define an Affinity that is positive, symmetric, and depends on the Euclidian distance between the data points.
Clustering - Can I use PCA to do variable selection for cluster analysis? How PCA would help the K-mean clustering analysis? Everyday analytics: PCA and K-means Clustering of Delta Aircraft. Introduction I work in consulting.
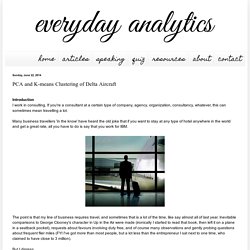
If you're a consultant at a certain type of company, agency, organization, consultancy, whatever, this can sometimes mean travelling a lot. Many business travellers 'in the know' have heard the old joke that if you want to stay at any type of hotel anywhere in the world and get a great rate, all you have to do is say that you work for IBM. The point is that my line of business requires travel, and sometimes that is a lot of the time, like say almost all of last year. Inevitable comparisons to George Clooney's character in Up in the Air were made (ironically I started to read that book, then left it on a plane in a seatback pocket), requests about favours involving duty free, and of course many observations and gently probing questions about frequent flier miles (FYI I've got more than most people, but a lot less than the entrepreneur I sat next to one time, who claimed to have close to 3 million).
But I digress. Background. Cluster and Principal Component Analysis. In the first part of this tutorial we shall imagine ourselves in a satellite taking photographs of the earth.
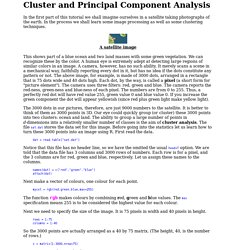
In the process we shall learn some image processing as well as some clustering techniques. This shows part of a blue ocean and two land masses with some green vegetation. We can recognize these by the color. A human eye is extremely adept at detecting large regions of similar colors in an image. A camera, however, has no such ability. Dat = read.table("sat.dat") Notice that this file has no header line, so we have the omitted the usual head=T option. Names(dat) = c("red","green","blue") attach(dat) Next make a vector of colours, one colour for each point. mycol = rgb(red,green,blue,max=255) The function rgb makes colours by combining red, green and blue values.
Rows = 1:75 columns = 1:40 So the 3000 points are actually arranged as a 40 by 75 matrix.