
Nebul.us Shows You Your Activity on the Web. Nebul.us is an online application, currently in private beta, that aggregates and visualizes your online activity.
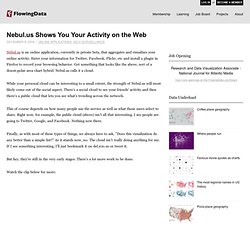
Enter your information for Twitter, Facebook, Flickr, etc and install a plugin in Firefox to record your browsing behavior. Get something that looks like the above, sort of a donut-polar area chart hybrid. Nebul.us calls it a cloud. While your personal cloud can be interesting to a small extent, the strength of Nebul.us will most likely come out of the social aspect. There's a social cloud to see your friends' activity and then there's a public cloud that lets you see what's trending across the network. This of course depends on how many people use the service as well as what those users select to share. Finally, as with most of these types of things, we always have to ask, "Does this visualization do any better than a simple list? " But hey, they're still in the very early stages.
Watch the clip below for more: Quantified Nerds. The quantified self sounds great on paper.
The task: keep track of important facets of your daily life. The result: gain a better understanding of your day-to-day and make better educated decisions, based on the numbers instead of false assumptions and shots in the dark. Auger Loizeau: Happylife. What would it mean for an electronic device to know more about your partner's emotional state than you do?
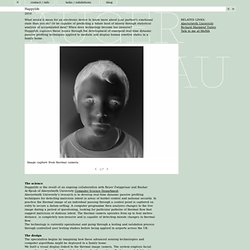
Or be capable of predicting a future bout of misery through statistical analysis of accumulated data? When does technology become too invasive? Happylife explores these issues through the development of emergent real-time dynamic passive profiling techniques applied to mediate and display human emotive states in a family home. Atlas of the Habitual. If you had a visualization of every place you've been for 200 days, what could you do with it?
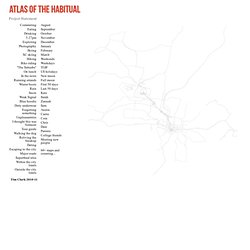
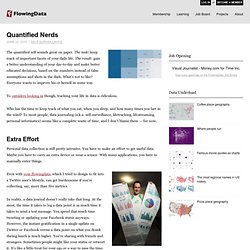
What could it tell you about yourself and how could others use the data? Technology allows us to see information in a way we never could before. Atlas of the Habitual is about creating data out of the everyday, the hyper-digitizing of your life. This atlas is a catalog of my experiences over 200 days. Life as Captured in Charts and Graphs. Track your daily stress and health levels with Basis. With the success of FitBit and the current wave of self-tracking, it was only a matter of time before something like Basis came out (currently for pre-order).
It's the same idea as FitBit, which is a clip that tracks your movement so you can see how much you move and monitor your sleep patterns. Data visualization meets game design to explore your digital life. The list of one-off applications that visualize your digital life, whether it be your Twitter feed, Facebook updates, or Foursquare checkins, has been growing for a short while.
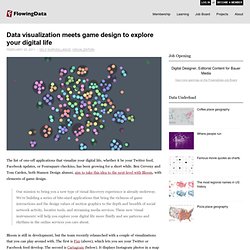
Ben Cerveny and Tom Carden, both Stamen Design alumni, aim to take this idea to the next level with Bloom, with elements of game design. Our mission to bring you a new type of visual discovery experience is already underway. We’re building a series of bite-sized applications that bring the richness of game interactions and the design values of motion graphics to the depth and breadth of social network activity, locative tools, and streaming media services.
These new ‘visual instruments’ will help you explore your digital life more fluidly and see patterns and rhythms in the online services you care about. Bloom is still in development, but the team recently relaunched with a couple of visualizations that you can play around with. What online marketers know about you. Andrew Garcia Philips and Sarah Slobin (plus five data gatherers) of The Wall Street Journal report on the prevalence of trackers and cookies on the fifty most popular U.S. websites: Marketers are spying on Internet users — observing and remembering people's clicks, and building and selling detailed dossiers of their activities and interests.
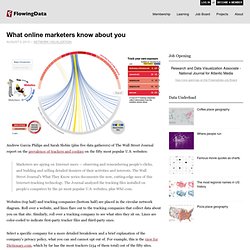
The Wall Street Journal's What They Know series documents the new, cutting-edge uses of this Internet-tracking technology. The Journal analyzed the tracking files installed on people's computers by the 50 most popular U.S. websites, plus WSJ.com. Websites (top half) and tracking companies (bottom half) are placed in the circular network diagram. Self-hacking / life-blogging / quantified-self & “Moodscope” From program description: “a group of ‘self-hackers’ in London who use the very latest technology to log information about their lives.
Les jeunes sur Internet. Se construire un autre chez-soi. 1Les liens entre la Toile et les adolescents analysés depuis plus d’une décennie semblent être un terrain d’étude particulièrement fécond pour penser la société des jeunes.
Constatant qu’une très grande majorité d’entre eux s’approprie relativement rapidement cette technologie, nous nous sommes interrogées sur les raisons de ce succès. Marc L*** Mis en ligne le mercredi 7 janvier 2009 ; mis à jour le mardi 28 avril 2009.
Bon annniversaire, Marc. Le 5 décembre 2008, tu fêteras tes vingt-neuf ans. Tu permets qu’on se tutoie, Marc ? Tu ne me connais pas, c’est vrai. Mais moi, je te connais très bien. Tracking Attention, Social Activity, and Our Environment. Much of the previous coverage in “The Measured Life” has focused on devices to track physical factors, such as sleep, activity and blood pressure. In today’s guest post, Michael Nagle, founder of Sprout, a community education organization, and the head of the Boston branch of the Quantified Self, talks about tools for tracking other facets of our lives and our interactions with the world.
Many of the new instruments of the Quantified Self increase our personal capacity to measure our bodies. A $200 Zeo can do much of the analysis that formerly could only be done in a $2,000 a night sleep lab. The $99 Fitbit can tell you not just how much you exercised, but how many steps you took and how many calories you burned. Avec "Me on the web", Google vous aide à mieux gérer votre identité sur le web. Jeudi 16 juin Web - 16 juin 2011 :: 09:03 :: Par Eric. Collusion, pour visualiser comment nous sommes tracés en ligne. Atul Varma est décidément quelqu'un que j'apprécie. Déjà à l'initiative de Hackasaurus, il vient de lancer un nouveau projet pour aider les internautes à mieux comprendre le Web: Collusion est une extension pour Firefox[1] pour permettre de mieux comprendre comme les régies publicitaires en ligne nous suivent à la trace.
L'extension collecte les cookies déposés par chaque page que nous visitons, détermine grâce au site PrivacyChoice s'ils émanent de sociétés qui font du traçage, et affiche une synthèse des traces que nous laissons. Pour mieux comprendre, visitez la démonstration qu'Atul a mise en ligne. Elle simule une visite sur quelques sites. Subjective cartography. Une société de la requête (1/4) : De la Googlisation de nos vies. En 2008, Geert Lovink, animateur de NetworkCultures, l’Institut des cultures en réseau, a publié, un intéressant essai sur la Société de la requête et la Googlisation de nos vies. Dans cet article, il adressait de pertinentes question à notre dépendance à Google et tentait de faire le point sur les rares critiques à l’encontre de l’Ogre de Mountain View.
En ouverture d’un dossier sur Google et les moteurs de recherche, la traduction de cette article nous a semblé une première adresse importante. Traduction. La société de la requête et la Googlisation de nos vies Un hommage à Joseph Weizenbaum. 02. Deligny et les cartes. Observatoire des nouveaux médias » Blog Archive » Battre les cartes, ou la mise en relation de deux territoires. Le mercredi 26 novembre, au même moment sur deux territoires différents : à l’Ensad, Boris Beaude, Bureau d’études et Philippe Vasset parlent de leurs travaux sur la thématique de la cartographie relationnelle (colloque Mobilisable). à l’Ensba, Jean-Philippe Antoine présente Tracer Joseph Beuys et Fernand Deligny (séminaire « des Territoires »).
Temps T1 : je vais écouter Jean-Philippe Antoine ‘en live’ (je travaille en arts plastiques avec des enfants autistes, alors je ne peux pas manquer Deligny). Où va la “quantification de soi” Christian Nold. 23chi04.pdf (Objet application/pdf) Félix Guattari. Emotional cartography. Carte subjective.
Friend Wheel sur Facebook. Géographie subjective. Cartographies subjectives : PLASTOL. Marseille subjective - Mai 2005 - Une semaine de restitutions-actives et ouvertes (1) de deux années de projets urbains, croisées avec d'autres démarches -artistiques ou non- de participants, passants impliqués,tous "spécialistes" du quartier, de la ville ou de leur parcours de vie.
Rencontres, expérimentations, retours collectifs et débats au Distributeur Officiel, notre lieu de travail partagé_ Présentation active et activée collectée et collective des travaux, ré-invention d'outils d'analyses urbaines, récolte partagée de données subjectives sur la ville, construction de cartes, écriture de textes de légendes: récits de vie et d'expériences, générateurs de pensées urbaines complexes, lectures, débats et performances. Carte-repérages / Zones d'A. Collectives / Marseille 2004- Marseille subjective_au Distri.Off. _Photos&montage&lectures : Sathyam_ Marseille subjective_ Semaine collective_au Distr.Off_
Eclairages pour le 21e siècle : Google, le monde et moi. Le 9 mars avait lieu à la Bibliothèque publique d’information du Centre Pompidou, dans le cadre du cycle « Eclairage pour le 21e siècle », un débat sur Google, organisé en partenariat avec Place de la Toile, Chronique de la rentrée littéraire et InternetActu.net. Animé par Abeline Majorel, le débat réunissait Ariel Kyrou, l’auteur de Google God, cette déclaration d’amour et de haine, de fascination et de rejet sur ce monstre du quotidien, également rédacteur en chef du site Culture Mobile et membre du collectif de rédaction de la revue Multitudes ;Daniel Ichbiah rédacteur en chef du magazine Comment ça marche, écrivain, auteur notamment de Comment Google mangera le monde ?
Humanités et sciences cognitives (1/4) : Une nouvelle critique littéraire. Par Rémi Sussan le 22/04/10 | 5 commentaires | 4,653 lectures | Impression A l’heure où les humanités deviennent de plus en plus numériques, comment les neurosciences peuvent-elles permettre de mieux comprendre l’évolution de notre culture ? La création littéraire et artistique peut-elle être éclairée par les sciences cognitives ? Où est passé la puissance de la “pensée visuelle” Dans le dernier numéro de Wired, l’éditorialiste Clive Thompson évoque la puissance de la pensée visuelle, c’est-à-dire celle qui s’exprime par le dessin plutôt que par les mots. Pour cela, il convoque le dernier livre de Dan Roam (blog), auteur du Retour de la serviette (The Back of the Napkin, évoquant la serviette en papier sur laquelle on griffonne souvent un petit schéma éclairant pendant un repas d’affaires), dans lequel ce dernier montre que notre culture repose trop fortement sur les mots.
Nos systèmes scolaires et politiques sont conçus pour promouvoir des gens éloquents dont le mode de pensée est essentiellement verbal. L’étude des comportements peut-elle permettre de les changer ? (1/4) : “Le progrès a besoin d’être mieux géré” Pour Dan Ariely, celui qui a popularisé la théorie de l’économie comportementale, auteur du best-seller international C’est vraiment moi qui décide (blog), la crise économique de 2008 est la preuve que nos décisions, même en matière d’argent, ne sont pas toutes rationnelles, comme il le clame depuis longtemps.
Mais si l’approche rationnelle des marchés ne peut pas nous protéger de nous-mêmes, quel modèle devons-nous utiliser, lui demande Karen Christensen pour in Business ? Errare humanum est : le progrès à besoin d’être mieux géré « Le modèle rationnel est malléable. Se balader sur le graphe du territoire : Linkfluence cartographie la rive droite de Bordeaux. Par Hubert Guillaud le 20/10/10 | 3 commentaires | 2,179 lectures | Impression Linkfluence vient de publier une cartographie des sites de la rive droite de Bordeaux (que nous évoquions hier dans notre billet sur L’hyperlocal révélé). Comment les métaphores programment notre esprit. Par Rémi Sussan le 22/03/11 | 10 commentaires | 8,128 lectures | Impression. Comprendre Facebook (2/3) : Facebook, technologie relationnelle. Vers la science personnelle. Le blog de CitéLabo: Vers un design des flux - Une recherche sur l'innovation familiale, intervention de Marie-Haude Caraës, Habita(n)ts Connectés.
Brains, Behavior & Design.