
22 free tools for data visualization and analysis. Page 10 of 10 Text/word clouds Some data visualization geeks think word clouds are either not very serious or not very original.
You can think of them as the tiramisu of visualizations -- once trendy, now overused. But I still enjoy these graphics that display each word from a text file once, with the size of the words varying depending on how often each one appears in the source. IBM Word-Cloud Generator What it does: Several tools mentioned previously can create word clouds, including Many Eyes and the Google Visualization API, as well as the website Wordle (which is a handy tool for making word clouds from websites instead of text files). What's cool: This is a quick, fun and easy way to find frequency of words in text. Drawbacks: Because it's trying to ignore words such as "a" and "the," the basic configuration can miss some important terms. Skill level: Advanced beginner. Runs on: Windows, Mac OS X and Linux running Java.
Learn more: Check the examples that come with the download. Upload your spreadsheet. Are You A Data Ninja? Commercial Open Source Business Intelligence. What is the Pentaho BI Project?
The Pentaho BI Project is an ongoing effort by the Open Source community to provide organizations with best-in-class solutions for their enterprise Business Intelligence (BI) needs. The Pentaho BI Project encompasses the following major application areas: Reporting Analysis Dashboards Data Mining Business Intelligence Platform Who benefits from the Pentaho BI Project? Java™ developers who can use project components to rapidly assemble custom BI solutions ISVs who can enhance the value and capability of their solutions by embedding BI functionality End-Users who can rapidly deploy packaged BI solutions which are either competitive or superior to traditional commercial offerings at a dramatically lower cost The Pentaho BI Project team who are free to pursue their passion for BI while being a part of the Open Source movement which is revolutionizing the software industry to better serve users What role does the Pentaho Corporation serve?
Definitely not. Gephi Quick Start. Gephi - The Open Graph Viz Platform. What is Silk? Population simulator.
The 36 best tools for data visualization. It's often said that data is the new world currency, and the web is the exchange bureau through which it's traded.
As consumers, we're positively swimming in data; it's everywhere from labels on food packaging design to World Health Organisation reports. As a result, for the designer it's becoming increasingly difficult to present data in a way that stands out from the mass of competing data streams. Get Adobe Creative Cloud One of the best ways to get your message across is to use a visualization to quickly draw attention to the key messages, and by presenting data visually it's also possible to uncover surprising patterns and observations that wouldn't be apparent from looking at stats alone. And nowadays, there's plenty of free graphic design software to help you do just that. As author, data journalist and information designer David McCandless said in his TED talk: "By visualizing information, we turn it into a landscape that you can explore with your eyes, a sort of information map.
Discovering and Illustrating Patterns in Data. Visualization and Statistics. Polymaps. Tutorials. How to Make a State Grid Map in R Something of a cross between a reference table and a map, the state grid provides equal space to each state and a semblance of the country to quickly pick out individual states.
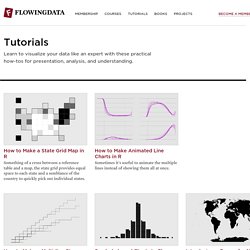
How to Make Animated Line Charts in R Sometimes it's useful to animate the multiple lines instead of showing them all at once. How to Make a Multi-line Step Chart in R For the times your data represents immediate changes in value. Symbols-based Charts to Show Counts in R Add visual weight by using individual items to show counts. Introducing a Course for Mapping in R Mapping geographic data in R can be tricky, because there are so many ways to complete separate tasks. How to Edit R Charts in Adobe Illustrator A detailed guide for R users who want to polish their charts in the popular graphic design app for readability and aesthetics. How to Make an Animated Map in R, Part 4 In the the last part of the four-part series, you make a longer animation with more data and annotate. Datavisualization.ch Selected Tools.