
Forecasting: principles and practice. Welcome to our online textbook on forecasting.

This textbook is intended to provide a comprehensive introduction to forecasting methods and to present enough information about each method for readers to be able to use them sensibly. We don’t attempt to give a thorough discussion of the theoretical details behind each method, although the references at the end of each chapter will fill in many of those details. The book is written for three audiences: (1) people finding themselves doing forecasting in business when they may not have had any formal training in the area; (2) undergraduate students studying business; (3) MBA students doing a forecasting elective. We use it ourselves for a second-year subject for students undertaking a Bachelor of Commerce degree at Monash University, Australia. For most sections, we only assume that readers are familiar with algebra, and high school mathematics should be sufficient background.
Use the table of contents on the right to browse the book. ManuscriptChecklist < Main < Vanderbilt Biostatistics Wiki. Checklist for Authors | References | Editable References Design and Sample Size Problems Use of an improper effect size If a study is designed to detect a certain effect size with a given power, the effect size should never be the observed effect from another study, which may be estimated with error and be overly optimistic.
The effect size to use in planning should be the clinically or biologically relevant effect one would regret missing. Usually the only information from prior studies that is useful in sample size estimation are (in the case of a continuous response variable with a symmetric distribution) estimates of the standard deviation or the correlation between two measurements on the same subject measured at two different times, or (in the case of a binary or time to event outcome) event probabilities in control subjects. Relying on standardized effect sizes. Statistical Computing Seminars. UCLA Statistical Consulting Classes and Workshops Classes and Workshops, Spring 2014 SAS SQL Programming 1, Tuesday, March 25 from 9 a.m. to 5 p.m. and Wednesday, March 26 from 9 a.m. to 12 noon, sign up here (although this workshop will take 1.5 days, you only need to sign up once).
This hands-on course teaches you how to process SAS data using Structured Query Language (SQL). Topics include manipulating, summarizing, and joining data. NOTE: Only those who are currently affiliated with UCLA may attend this workshop. SAS Macro Programming 1, Wednesday, March 26 from 1 to 5 p.m. and Thursday, March 27 from 9 a.m. to 5 p.m. in CLICC Classroom C, sign up here (although this workshop will take 1.5 days, you only need to sign up once). Past Classes and Workshops Available Online The content of this web site should not be construed as an endorsement of any particular web site, book, or software product by the University of California. Ideas, issues, concepts, subjects - v. Diagnostics: complete notes. Hadley's notes.
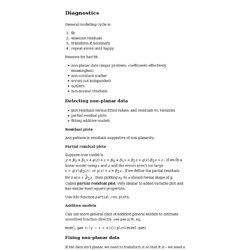
General modelling cycle is: fit examine residuals transform if necessary repeat above until happy Reasons for bad fit: non-planar data (major problem, coefficients effectively meaningless) non-constant scatter errors not independent outliers non-normal residuals Detecting non-planar data plot residuals versus fitted values, and residuals vs. variables partial residual plots fitting additive models Residual plots.
FAQ: What are pseudo R-squareds? FAQ: What are pseudo R-squareds?
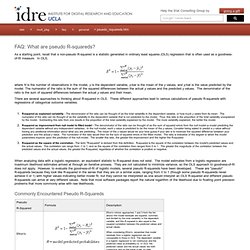
As a starting point, recall that a non-pseudo R-squared is a statistic generated in ordinary least squares (OLS) regression that is often used as a goodness-of-fit measure. In OLS, where N is the number of observations in the model, y is the dependent variable, y-bar is the mean of the y values, and y-hat is the value predicted by the model. The numerator of the ratio is the sum of the squared differences between the actual y values and the predicted y values. The denominator of the ratio is the sum of squared differences between the actual y values and their mean. There are several approaches to thinking about R-squared in OLS.
R-squared as explained variability - The denominator of the ratio can be thought of as the total variability in the dependent variable, or how much y varies from its mean. Ricci-refcard-ts.pdf (application/pdf Object) Logistic Regression: Statnotes, from North Carolina State Univer. Overview Binary logistic regression is a form of regression which is used when the dependent is a dichotomy and the independents are of any type.
Multinomial logistic regression exists to handle the case of dependents with more classes than two, though it is sometimes used for binary dependents also since it generates somewhat different output described below. When multiple classes of a multinomial dependent variable can be ranked, then ordinal logistic regression is preferred to multinomial logistic regression since ordinal regression has higher power for ordinal data. Note that continuous variables are not used as dependents in logistic regression. Unlike logit regression, there can be only one dependent variable. More recently, generalized linear modeling (GZLM) has appeared as a module in SPSS, SAS, and other packages.
A Primer for Panel Data Analysis. Untitled.