
CoSketch.com - Online Whiteboard Collaboration. Customizing Phrase Net. Many Eyes Log in Explore Visualizations Data sets Comments Topic centers Participate Create a visualization Upload a data set Create a topic center Register Learn more Quick start Visualization types Data format and style About Many Eyes Blog Contact us Contact Report a bug Legal Terms of use Privacy Provide Feedback Popular tags: 2008 2009 2010 2011 A Obama US budget census crime education energy facebook food government health income internet lyrics media music network obama obesity people politics population president race smoking social speech spending state states statistics twitter unemployment us world See more » Customizing Phrase Net Data set: Pride and Prejudice, Jane Austen (Version 1) Your visualization will look like this: Required Visualization title Optional Tags Add your tags (separated by a space): Suggested tags: (Click to add or remove) literature Description (type the code from the image) Accessible Captcha.
Data visualisation DIY: our top tools. What data visualisation tools are out there on the web that are easy to use - and free?
Here on the Datablog and Datastore we try to do as much as possible using the internet's powerful free options. That may sound a little disingenuous, in that we obviously have access to the Guardian's amazing Graphics and interactive teams for those pieces where we have a little more time - such as this map of public spending (created using Adobe Illustrator) or this Twitter riots interactive. But for our day-to-day work, we often use tools that anyone can - and create graphics that anyone else can too. So, what do we use? Google fusion tables This online database and mapping tool has become our default for producing quick and detailed maps, especially those where you need to zoom in. The main advantage is the flexibility - you can can upload a kml file of regional borders, say - and then merge that with a data table. This excellent tutorial by Google's Kathryn Hurley is a great place to start. Datamarket. Gephi, an open source graph visualization and manipulation software.
IDroo. Literature and Latte - Scapple for Mac OS X and Windows. Rough It Out Scapple doesn’t force you to make connections, and it doesn’t expect you to start out with one central idea off of which everything else is branched.
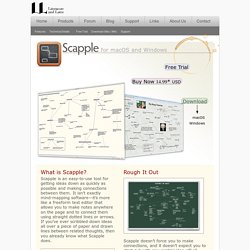
There’s no built-in hierarchy at all, in fact—in Scapple, every note is equal, so you can connect them however you like. The idea behind Scapple is simple: when you are roughing out ideas, you need complete freedom to experiment with how those ideas best fit together. It’s Scapple Simple Creating notes is as easy as double-clicking anywhere on the canvas and then typing; making connections between ideas is as painless as dragging and dropping one note onto another. What is Scapple?
Scapple is an easy-to-use tool for getting ideas down as quickly as possible and making connections between them. Scapple’s nonlinear approach to the process of creative thinking is similar to what Gabriele Rico calls “clustering” in her popular book, Writing the Natural Way. *Local taxes may apply. Features Write notes anywhere on the virtual paper. Many Eyes. Online Mind Mapping and Brainstorming app - SpiderScribe.
Parallel Sets. Parallel Sets (ParSets) is a visualization application for categorical data, like census and survey data, inventory, and many other kinds of data that can be summed up in a cross-tabulation. ParSets provide a simple, interactive way to explore and analyze such data. Even though the screenshots here show the Mac version, the program also runs on Windows and Linux.
Links to the executables are in the Download Section. Basic Operation To open an existing dataset, select it in the list and either double-click it or click the Open button. The horizontal bars in the visualization show the absolute frequency of how often each category occurred: in this example, the top line shows the distribution between the passenger classes on the Titanic and the crew. The middle dimension shows a male to female ratio of almost 4 to 1. Between the dimension bars are ribbons that connect categories and split up. Interaction Move your mouse over the display to see the tooltip telling you more about the data. RAW. Visual Understanding Environment. Word Tree.