
Visual.ly. Infographics zone. Killer Infographics. The Noun Project. Infographics. Infographics. Infographics. How To Design for Viral Growth [Infographic] Viral growth is the holy grail for Web-based companies.
![How To Design for Viral Growth [Infographic]](http://cdn.pearltrees.com/s/pic/th/design-growth-infographic-50823997)
Entrepreneurs spend late nights thinking of tactics like funny videos, PR stunts, Facebook quizzes and other mechanics that can make their product “go viral.” Viral growth is alluring because it 1) can generate a ton of users quickly, 2) the follow-on viral-acquired users are typically free, and 3) it generates press and buzz which in turn fuel the viral loop. Free users and lots of buzz? It’s no wonder everyone is working on one viral hack or another. But viral growth is not just a happy accident.
Looking for a primer on designing for viral growth? Click the image to see the full-size version. You should embed this infographic on your site – click to copy the embed code below. Life In Five Seconds. Multimedialab. “Flux des agences de presse - création d’information par la méthode” est le mémoire de fin d’étude présenté par Lionel Maes en 2008 à l’Erg (École de Recherche Graphique).

Lionel Maes a terminé l’an dernier son cycle d’études à l’Erg en finalité “Arts numériques”. Son mémoire, intitulé “Flux des agences de presse - création d’information par la méthode”, s’intéresse aux conditions de diffusion et d’usages des flux d’informations produits par les agences de presse. En parallèle, cette réflexion théorique a fait l’objet d’une recherche pratique, concrétisée par la réalisation d’un programme de visualisation de l’information et d’un prototype d’installation multimédia interactive. Visualisation de données. C’est dans ce contexte que Lionel Maes aborde la notion de visualisation de données, discipline graphique engendrée par l’informatique, dont la tâche consiste à conditionner graphiquement l’information brute dans le but d’en permettre une lecture.
Homeostatic. Image = code. Marc Wathieu. Smashing magazine. Advertisement Data visualizations and infographics can make complex datasets easier to understand and comprehend.

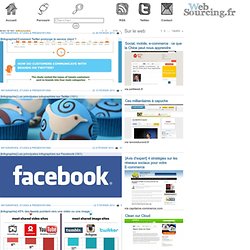
By creating a graphical represenatation of data and statistics, complicated concepts and information can make more sense in less time. Aesthetics. Websourcing. Avec le tag Infographie Le 26 février 2013 3 Infographies, Etudes & Présentations [Infographie] Comment Twitter prolonge le service client ?

Le 12 février 2013 4 [Infographie] Les principales infographies sur Twitter (101) Le 8 février 2013 10 [Infographie] Les principales infographies sur Facebook (161) Le 5 février 2013 5 [Infographie] 45% des tweets pointent vers une vidéo ou une image. Nicholas Felton. Moritz.stefaner. Information Is Beautiful. Infographic / informationisbeautiful. 31 Infographic. I 75 Votes Observations on Internet usage and interesting Internet Facts: The Internet is more than 40 years old.
In 1990, Tim Berners-Lee coined the phrase ‘World Wide Web’ (www). Mosaic, the first web browser arrived in 1993. 18 countries still do not have Internet access. Internet Facts for Kids: 4 out of every 6 kid’s parents have little or no idea what their kid surfs on the Internet. Internet Statistics by Country/Continent: The top 10 countries on the Internet together have 1.17 billion Internet users. Dotcom (.com) Facts: The dotcom has turned 25 this year, and was actually a short form for commerce as it was initially set up for the use of e-commerce websites. According to Nielsen NetRatings The average person each month usually visits 59 domains(website URL’s), Views 1,050 pages averaging 45 seconds for each page, and spend about 25 hours a month doing this! This 31 infographic explores INTERNETFacts & Figures (history & statistics): 1- Infographic – How The Internet Works Sources: