
Fusion Tables. Code Examples - Google Chart Tools. Here are some code samples to demonstrate using the Google Visualization API.
Table Example Customized Table Example Gauge Example Temperature: Interaction example. Introduction to Using Chart Tools - Google Chart Tools. Google Charts provides a perfect way to visualize data on your website.
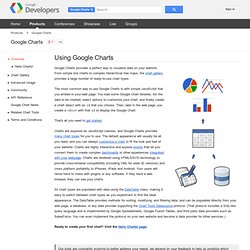
From simple line charts to complex hierarchical tree maps, the chart gallery provides a large number of ready-to-use chart types. The most common way to use Google Charts is with simple JavaScript that you embed in your web page. You load some Google Chart libraries, list the data to be charted, select options to customize your chart, and finally create a chart object with an id that you choose. Then, later in the web page, you create a <div> with that id to display the Google Chart. The Miso Project. Fast Analytics and Rapid-fire Business Intelligence from Tableau Software. Highcharts - Interactive JavaScript charts for your webpage.