

Natural history of chronic illnesses. Lung. Tumori: studio Usa, non è dimostrato che screening salvi vite. Roma, 7 gen.
(AdnKronos Salute) - "Non è mai stato dimostrato che lo screening oncologico può salvare vite umane". E' quanto afferma la ricerca dell'Oregon Health and Science University pubblicata sul 'British Medical Journey'. Secondo lo studio "la convinzione che questo tipo di prevenzione possa ridurre la mortalità legata ai tumori, piuttosto che quella generale della popolazione, è errata. E' proprio quest'ultima che dovrebbe essere il punto di riferimento per cui lo screening dovrebbe essere giudicato". Nel loro lavoro gli scienziati prendono in esame alcuni esempi come lo screening per il cancro alla prostata o al seno: dove esami, sovradiagnosi ed una eccessiva medicalizzazione "possono causare più male che bene", avvertono i ricercatori.
Piano Nazionale della Prevenzione. EUROCARE. ENCR download - European Network of Cancer Registries. Ospedali italiani. ICD-O-3 sede. ICD-9-CM. ICD-10 Version:2015. Advanced search lets you search selected properties of the classification.
You could search all properties or a selected subset only First, you need to provide keywords in the Search Text field then check the properties that you'd like to include in the search. The system will search for the keywords in the properties that you've checked and rank the results similar to a search engine The results will be displayed in the Search Results pane. If the search query hits more than 200 results, then only the top 200 will be displayed. If you provide more than one keyword, the system will search for items that have all the keywords. Wildcards: You may also use wildcard character * . see examples below. OR operator : It's possible to have the results that have either one or another keyword. Examples: 1. 2. 3. 4. Standardized Incidence Ratio and Confidence Limits. Home > Equations and Algorithms > Standardized Incidence Ratio and Confidence Limits Various authors discuss the standardized mortality ratio (SMR) and provide exact and approximate confidence limits for the true SMR.
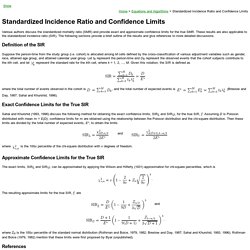
These results are also applicable to the standardized incidence ratio (SIR). The following sections provide a brief outline of the results and give references to more detailed discussions. Definition of the SIR Suppose the person-time from the study group (i.e. cohort) is allocated among M cells defined by the cross-classification of various adjustment variables such as gender, race, attained age group, and attained calendar year group. Represent the standard rate for the kth cell, where k = 1, 2, ..., M. Eps to dxf - CloudConvert. AutoCAD DXF & DWG to ESRI Shapefile or Google KML. Venn diagram. Example[edit] Sets A (creatures with two legs) and B (creatures that can fly) Humans and penguins are bipedal, and so are then in the orange circle, but since they cannot fly they appear in the left part of the orange circle, where it does not overlap with the blue circle.
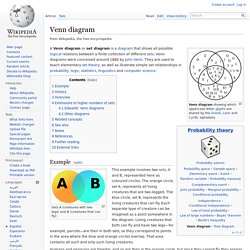
Mosquitoes have six legs, and fly, so the point for mosquitoes is in the part of the blue circle that does not overlap with the orange one. Creatures that are not two-legged and cannot fly (for example, whales and spiders) would all be represented by points outside both circles. History[edit] Venn diagrams were introduced in 1880 by John Venn (1834–1923) in a paper entitled On the Diagrammatic and Mechanical Representation of Propositions and Reasonings in the "Philosophical Magazine and Journal of Science", about the different ways to represent propositions by diagrams.[1][2] The use of these types of diagrams in formal logic, according to Ruskey and M. In the 20th century, Venn diagrams were further developed. Building a population-based diabetes register: An Italian experience - Diabetes Research and Clinical Practice.
Fig. 1 Overlapping sources for identification of diabetes cases represented with Edward's diagram five sets.
Fig. 2 Crude prevalence on December 31st, 2009 by sex and age groups and by type of diabetes and age groups. Reggio Emilia province. Progetto Matematica - L'integrale di Riemann. ICD-O 3 ita. Virtual Laboratories in Probability and Statistics. Regression Analysis: Basic Concepts. Multiple Linear Regression. The Estimated Annual Percent Change methodology. Curva ROC.