
Easel Créer de belles infographies facilement. Many Eyes. Create and share visual ideas online. WebHome < Digitalmethods. The Link | The Website | The Engine | The Spheres | The Webs | Post-demographics | Networked Content Welcome to the Digital Methods course, which is a focused section of the more expansive Digital Methods wiki.
The Digital Methods course consists of seven units with digital research protocols, specially developed tools, tutorials as well as sample projects. In particular this course is dedicated to how else links, Websites, engines and other digital objects and spaces may be studied, if methods were to follow the medium, as opposed to importing standard methods from the social sciences more generally, including surveys, interviews and observation. Here digital methods are central. Short literature reviews are followed by distinctive digital methods approaches, step-by-step guides and exemplary projects.
Unit 1: The Link Unit 2: The Website Unit 3: The Engine On the Web, sources compete to offer the user information. Unit 4: The Spheres Unit 5: The Webs Unit 7: Wikipedia and Networked Content. Log-in. Requests for Issue Crawler accounts require approval by the Govcom.org Foundation.
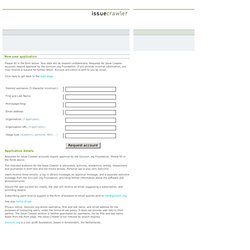
Please fill in the fields above. The intended audience for the Issue Crawler is advocates, activists, academics, artists, researchers and journalists in both new and old media senses. Personal use is also very welcome. Users receive three emails: a log-in details message, an approval message, and a separate welcome message from the Govcom.org Foundation, providing further information about the software and announcements. Should the user exceed ten crawls, the user will receive an email suggesting a subscription, and providing details. Subscribing users receive support in the form of answers to email queries sent to info@govcom.org.
See also terms of use. Privacy notice: Govcom.org stores username, first and last name, and email address for the purposes of contacting users, under the terms of use policy. Govcom.org is a non-profit foundation, based in Amsterdam, the Netherlands. 30 outils gratuits pour visualiser et analyser les données. Data Visualization Demo. Free Data Visualization Software. Choosel - Choosel: A data visualization framework for GWT. Bio-Mixer. Create visualization. Hello World - Impure Wiki. Fusion Tables. Bust your data out of its silo!

Get more from data with Fusion Tables. Fusion Tables is an experimental data visualization web application to gather, visualize, and share data tables. Visualize bigger table data online Filter and summarize across hundreds of thousands of rows. Then try a chart, map, network graph, or custom layout and embed or share it.
Two tables are better than one! Merge two or three tables to generate a single visualization that includes both sets of data. Make a map in minutes Host data online - and stay in control Viewers located anywhere can produce charts or maps from it. Visualize bigger table data online Import your own data Upload data tables from spreadsheets or CSV files, even KML. Visualize it instantly See the data on a map or as a chart immediately. Publish your visualization on other web properties Now that you've got that nice map or chart of your data, you can embed it in a web page or blog post.
Two tables are better than one! Make a map in minutes.