

Geovisualization. Geovisualization or Geovisualisation, short for Geographic Visualization, refers to a set of tools and techniques supporting geospatial data analysis through the use of interactive visualization.
Like the related fields of scientific visualization[1] and information visualization [2] geovisualization emphasizes knowledge construction over knowledge storage or information transmission.[1] To do this, geovisualization communicates geospatial information in ways that, when combined with human understanding, allow for data exploration and decision-making processes.[1][3][4] Traditional, static maps have a limited exploratory capability; the graphical representations are inextricably linked to the geographical information beneath. History[edit] The term visualization is first mentioned in the cartographic literature at least as early as 1953, in an article by University of Chicago geographer Allen K.
Philbrick. Geovisualization has continued to grow as a subject of practice and research. Between Friends. The idea of a social graph–a representation of a person’s network of friends, family, and acquaintances–gained currency last year as the popularity of online social networks grew: Facebook, for example, claims to have more than 64 million active users, with 250,000 more signing up each day.

It and other sites have tried to commercialize these social connections by allowing outside developers to build applications that access users’ networks. Facebook also advertises to a user’s contacts in accordance with the user’s online buying habits. The push to understand the nature and potential value of links between people online has led to imaginative ways to represent such networks. Here, we look at some of them. BlogosphereCommunities that form around the exchange of information stand out in Matthew Hurst’s visualizations of the blogosphere. Credit: Matthew Hurst. The Best Tools for Visualization. Visualization is a technique to graphically represent sets of data.
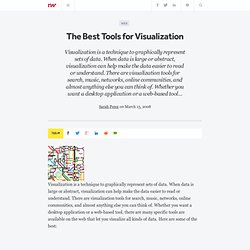
When data is large or abstract, visualization can help make the data easier to read or understand. There are visualization tools for search, music, networks, online communities, and almost anything else you can think of. Whether you want a desktop application or a web-based tool, there are many specific tools are available on the web that let you visualize all kinds of data. Here are some of the best: Visualize Social Networks Last.Forward: Thanks to Last.fm's new widget gallery, you can now explore a wide selection of extras to extend your Last.fm experience. Last Forward Friends Sociomap: Friends Sociomap is another Last.fm tools that generates a map of the music compatibility between you and your Last.fm friends.
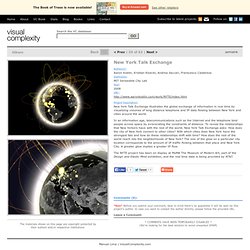
Fidg't: Fidg't is a desktop application that gives you a way to view your networks tagging habits. Fidg't The Digg Tools: One more: Digg Radar. YouTube: Visualize Music Musicovery Last.fm music visual tools: Amazon. GlobalMotion - Home. Mapping the Republic of Letters. Index Translationum. New York Talk Exchange. New York Talk Exchange illustrates the global exchange of information in real time by visualizing volumes of long distance telephone and IP data flowing between New York and cities around the world.
Map your moves. Data This map distills more than 4000 moves from over 1700 people, collected in an informal survey by WNYC, a New York based public radio station.

For generating the geo–coordinates from the entered ZIP codes, I used the free bulk geocoder at gpsvisualizer.com. I did not check every single data row in detail, so a few of the moves might be misrepresented. Mapping As most moves occurred from, to or within the New York area, this area displayed enlarged in the white circle at the center of the graphic. Visual markers Each circle corresponds to one zip code area. Data Visualization on Hispanic Migration: Shifting Perceptions on Labor Demand and Migrants’ Rights. Every year tens of thousands of people leave their homes in Latin America in the hope of reaching the United States of America.
Driven by grinding poverty, they travel in search of work and a more promising future. What do the citizens and residents of the United States really understand about the role Hispanic migrants play in the US economy and their impact on the labor market? Do we understand the importance of their function? Or the injustices and challenges they face under our current system? Do we understand the interplay between our economic condition and their presence in our labor force? Where's the remotest place on Earth? - Image 2. Outcome Mapping for the Latin American Trade Network Monitoring and Evaluating Research Outputs - View the resource - Outcome Mapping Learning community.
Social Networks. Social network analysis. Social network analysis (SNA) is the analysis of social networks.
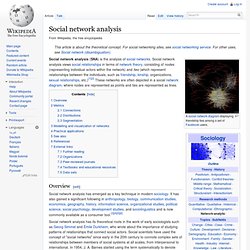
Social network analysis views social relationships in terms of network theory, consisting of nodes (representing individual actors within the network) and ties (which represent relationships between the individuals, such as friendship, kinship, organizations, sexual relationships, etc.)[1][2] These networks are often depicted in a social network diagram, where nodes are represented as points and ties are represented as lines. Overview[edit] Social network analysis has emerged as a key technique in modern sociology. It has also gained a significant following in anthropology, biology, communication studies, economics, geography, history, information science, organizational studies, political science, social psychology, development studies, and sociolinguistics and is now commonly available as a consumer tool.[3][4][5][6] Metrics[edit] Connections[edit] Distributions[edit]