

Zanifesto. 10 sites pour créer une infographie. Les infographies permettent de visualiser plus facilement un ensemble de données parfois complexe. Une image est parfois plus parlante qu’un long discours ! Elles permettent de comprendre en un coup d’œil les principaux enseignements d’une étude quantitative par exemple. Certains utilisent également ce type de visualisation pour présenter leurs compétences au sein d’un CV original. De nombreux services existent pour réaliser facilement une infographie : nous en avons sélectionné dix. Réaliser une infographie en ligne Infogr.am Une référence, puisque l’outil a déjà permis de créer plus de 340 000 infographies ! Piktochart Ici aussi, il s’agit d’une référence : plus de 100 000 comptes ont été créés sur le site, vous pouvez donc utiliser le service les yeux fermés ! Un sitio web para crear infografías con numerosas plantillas - Clases de Periodismo.
Adioma.com es una herramienta web que vuelve extremadamente sencilla la creación de infografías.

La herramienta es especialmente de interés para los periodistas que necesiten transmitir de forma clara conceptos complejos si necesidad de dominar todas las funciones de un software de diseño gráfico. La herramienta hace posible que cualquier pueda explicar cualquier tema mediante distintas gráficas. En estos espacios se pueden alterar los párrafos, los icono y la paleta de colores. Crea espectaculares Infografías con estas 10 herramientas gratuitas. Las infografías han tomado un peso relevante en Internet en el último lustro, no cabe duda que estamos ante una herramienta con un poder de engagement tremendo.
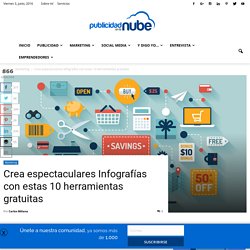
No es de extrañar que sea uno de los elementos que más solemos compartir. A pesar de parecer que es un herramienta nueva, la primera infografía está fechada hace más de 4.000 años, en el antiguo Egipto. Las 15 mejores herramientas para hacer infografías. Las infografías llevan mucho tiempo ganando importancia en el mundo del blogging y del marketing de contenidos y no sólo por el atractivo visual que aportan sino también como un medio de conseguir aumentar tus visitas, generar una mayor viralidad de tu contenido en las redes sociales y mejorar tu posicionamiento en Google a través de la atracción de enlaces naturales.
Es posible que el diseño no te guste especialmente o no se te dé bien pero creo que nunca es tarde para aprender cosas nuevas y que mejor que aprender a hacer infografías sabiendo todos los beneficios que puede aportarte. Sin más dilación te dejo con la lista 1. Infographics. About education news missions.

Free Infographic Maker. 7 Tools for Making an Infographic in an Afternoon. Infographics are such a fun and effective visual way to display information. We at Buffer have certainly used them quite a few times to share information. I always enjoy looking at them, but always feel like there is no way I could ever create one myself.
Or is there? There are so many tools being released every day allowing us to easily create better and better images— including infographics—to share and use in our marketing efforts. Even folks (like me!) I had a lot of fun researching and testing out a handful of different infographic makers, and I’d love to share the seven tools I liked best to easily create beautiful infographics. Watch me build an infographic in an afternoon (in 3 minutes) The key to working fast on an infographic? A couple highlights: 0:09 – Found a great template! (We’d love to know how videos like these feel for you! 9 Tools for Making Infographics in the Classroom. Creating great infographics need not be a chore, no matter if you’re a teacher or a student.
Taking information and presenting it in an artful and visually appealing way has never been easier, thanks to Web 2.0 tools. Before you dive in, here are some quick tips: Collect your data. If you have been collecting data, compile it all in a spreadsheet.Decide the best way to present your data (flyer-style, bar charts, line charts, Venn diagrams, histogram, scatter plot charts, flow charts, timelines, etc.).Design a rough sketch so you don’t end up flying blind.Pick your app and get to work! Now that you’ve got basic tips on how to get started, it’s time to get creative. Hohli Hohli is a bare-bones online chart builder. Powerpoint (Templates from Hubspot) Let’s not forget this old faithful as a great place to start. Like Hohli, this is another possible avenue for introducing infographics into your class. Crear infografías colaborativas con Google Drawing. 17 Fantastic Infographic Generators!
Data is crucial.

However, displaying a chunk of plain data can be monotonous. Infographics visualize plain data and make it visually more appealing. Data turned into infographic has a higher potential to go viral and be effective. While many of us are designers who can design amazing infographs, Infographic Generators can come in handy to Designers and non-designers alike.
They can be a time saving resource. 1. 2. 3. easellyEaselly is a great infographic generator that possesses a large range of infographic templates for you to play with. 4. 5. Sprites. 8 herramientas gratuitas para crear infografías “resultonas” Para comprobar que las infografías están de moda, basta con echar un vistazo a cualquier red social, sobre todo a Twitter y Pinterest, donde se reproducen literalmente como setas.
Y es que el potencial viral de las infografías es enorme. Pero, ¿cómo crear una infografía vistosa e interesante sin pasarnos horas y horas en Photoshop? Algunos dirán que esto es imposible, pero en la red de redes hay unas cuantas herramientas gratuitas que nos permiten, cuanto menos, agilizar el proceso. Creativebloq nos presenta a continuación algunas de las más interesantes: 1.
Online Charts Builder. Hohli Online Charts Builder New version: Try new version of Charts Builder, it based on new Google Charts API Load From Image URL: Chart Data can't equal to original, but very similar to it.

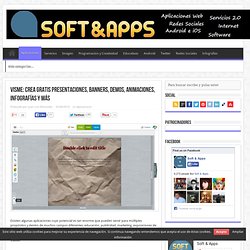
Create Interactive Online Presentations, infographics, animations & banners in HTML5 - Visme by Easy WebContent. Visme: crea gratis presentaciones, banners, demos, animaciones, infografías y más. Existen algunas aplicaciones cuyo potencial es tan enorme que pueden servir para múltiples propósitos y dentro de muchos campos diferentes: educación, publicidad, marketing, exposiciones de productos, diseño, periodismo, etc.
11 herramientas para crear infografías. Te presentamos 11 herramientas para crear gráficos que te permitirán desarrollar de forma diferente el contenido de tus publicaciones. 1.

Easel.ly. Infographics, Charting and Mapping Tools & Apps #stats #statistics #graphics #infographics #infographic #graphs #in #imagesinformation #datavisualization #maps #bigdata #mapping #charts #charting #datamapping. ¿Por qué crear una infografía? #infografia #infographic #marketing. MockFlow - Online Wireframe Tool. Infographics, Charting and Mapping Tools & Apps #stats #statistics #graphics #infographics #infographic #graphs #in #imagesinformation #datavisualization #maps #bigdata #mapping #charts #charting #datamapping.
25 consejos para hacer buenas infografías #infografia #infographic #design. 25 Best Online Tools to Create Your Own Infographics. Today’s article is dedicated to all those users who’s looking for some of the best Online tools to Create Infographics. So must try this opinion piece covered by us. We all know that visual representation speaks more than words written on paper and slideshow. The reason, is that it’s very easy to convey knowledge and engage its viewers. And due to which these Infographic things are very popular among users and creating lots of heat. I’m a blogger and know its importance in today life. Ok, let me ask one you one question, Out of full-length 1000-word article and one Infographinc which one you like to choose of go with.
So would you like to make your own Infographics and looking for some platform to make that thing happen then this article is surely your cup of tea. 1. Wordle is one of the best web app using which you can create beautiful and fully customizable word clouds Infographic just with few clicks. 2. 3. 4. 5. 6. 7. 40+ Tools to Create Infographics with Your Students. Here is a comprehensive list of some very good tools for making infographics. The list features more than 40 applications so you have a wide variety of options to choose from.While some of these tools are pretty basic and you can use them without any complications, others do require some advanced tech knowledge and design know-how.
As a teacher and educator, my favourite infographic making tools are Google Draw and Pictochart. I invite you to read this step by step visual guide to learn more about how you can easily set up your infographic using Google Draw. Also bear in mind that most of these tools require a sign-up and some of them are fremium: they have, besides the basic free version, a pro version that offers more advanced features. I ll let you now explore this list and looking forward to your feedback. How to Make an Infographic. 46 Tools To Make Infographics In The Classroom.
Infographics are interesting–a mash of (hopefully) easily-consumed visuals (so, symbols, shapes, and images) and added relevant character-based data (so, numbers, words, and brief sentences). The learning application for them is clear, with many academic standards–including the Common Core standards–requiring teachers to use a variety of media forms, charts, and other data for both information reading as well as general fluency. It’s curious they haven’t really “caught on” in schools considering how well they bridge both the old-form textbook habit of cramming tons of information into a small space, while also neatly overlapping with the dynamic and digital world. So if you want to try to make infographics–or better yet have students make them–where do you start?
The 46 tools below, curated by Faisal Khan, are a good place to start. Infographics & Data Visualization. Create infographics. Kuler.