
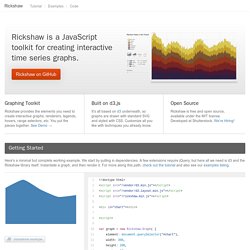
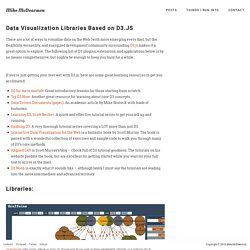
Data Visualization with D3.js. Rickshaw: A JavaScript toolkit for creating interactive time-series graphs. Graphing Toolkit Rickshaw provides the elements you need to create interactive graphs: renderers, legends, hovers, range selectors, etc.
You put the pieces together. See Demo → Vega: A Visualization Grammar. xCharts. The Miso Project. Dimple - A simple charting API for d3 data visualisations. rCharts. rCharts is an R package to create, customize and publish interactive javascript visualizations from R using a familiar lattice style plotting interface.
Installation You can install rCharts from github using the devtools package require(devtools)install_github('rCharts', 'ramnathv') Features The design philosophy behind rCharts is to make the process of creating, customizing and sharing interactive visualizations easy. Create rCharts uses a formula interface to specify plots, just like the lattice package. ## Example 1 Facetted Scatterplotnames(iris) = gsub("\\ Customize rCharts supports multiple javascript charting libraries, each with its own strengths.
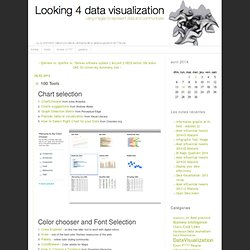
Polychart. We will create our first chart using Polychart, a javascript charting library based on the grammar of graphics, and inspired by ggplot2. r1 <- rPlot(mpg ~ wt | am + vs, data = mtcars, type = "point", color = "gear") r1$print("chart1") There, we have our first embedded chart with nice tooltips! Morris. 100 Tools. Chart selection.
RAW. Biovisualize.github.io/d3visualization/ Data Visualizatiion libraries based on D3.js. D3.js is the latest incarnation of a javascript data visualization library originally called Protovis by Michael Bostock.
This collection of interactive charting tools is open source and has inspired several additional libraries based on its powerful core components – several of which are listed below. For those of you new to the magic of D3, check out this introductory workshop by Mr. More Data Visualization Libraries Based on D3.JS - Mike McDearmon. There are a lot of ways to visualize data on the Web (with more emerging every day), but the flexibility, versatility, and energized development community surrounding D3.js makes it a great option to explore.
The following list of D3 plugins, extensions, and applications below is by no means comprehensive, but oughta be enough to keep you busy for a while. Quick Charting with D3js. Pretty charts with dimple.js – Anna Pawlicka. Bost.ocks.org/mike/d3/workshop/#94. Colorbrewer: Color Advice for Maps. d3: scales, and color. In protovis, scales were super-useful in just about everything.
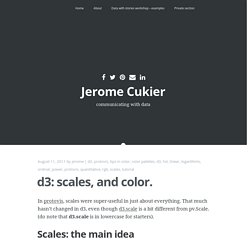
That much hasn’t changed in d3, even though d3.scale is a bit different from pv.Scale. (do note that d3.scale is in lowercase for starters). Scales: the main idea Simply put: scales transform a number in a certain interval (called the domain) into a number in another interval (called the range). For instance, let’s suppose you know your data is always over 20 and always below 80. But what if you suddenly have more or less space? This is much simpler, elegant, and easy to maintain. . … only more legible and shorter. Fun with scales In d3, quantitative scales can be of several types: linear scales (including quantize and quantile scales,logarithmic scales,power scales (including square root scales) While they behave differently, they have a lot in common. Domain and range For all scales, with the exception of quantize and quantile scales which are a bit different, domain and range work the same. Clamping Scales and nice numbers. d3.js ~ Treemap. Thinking with Joins.
Say you’re making a basic scatterplot using D3, and you need to create some SVG circle elements to visualize your data.
You may be surprised to discover that D3 has no primitive for creating multiple DOM elements. Wait, WAT? Sure, there’s the append method, which you can use to create a single element. Bost.ocks.org/mike/d3/workshop/#0. SVG and Handlebars JS Templates. I’ve been working with Handlebars JS for a while and wanted to use templating to generate portions of SVG.
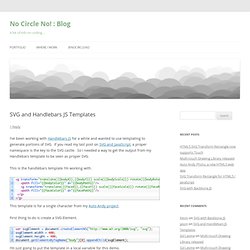
If you read my last post on SVG and JavaScript, a proper namespace is the key to the SVG castle. So I needed a way to get the output from my Handlebars template to be seen as proper SVG. This is the handlebars template I’m working with. This template is for a single character from my Auto Andy project. First thing to do is create a SVG Element. var svgElement = document.createElementNS(" "svg"); svgElement.width = 400; svgElement.height = 400; document.getElementsByTagName("body")[0].appendChild(svgElement); I’m just going to put the template in a local variable for this demo.
Next step is create some data and run it through the Handlebars template. When I compile the template with the data, I end up getting back a string that represents the final markup. The DOMParser found in the vanilla JavaScript looked to be the ticket. View Demo on jsFiddle Using jQuery? Arrays · mbostock/d3 Wiki. Wiki ▸ API Reference ▸ Core ▸ Arrays.
General Update Pattern, I. Interactive Data Visualization for the Web. Data is an extremely broad term, only slightly less vague than the nearly all-encompassing information.
What is data? (What isn’t data?) What kinds of data are there, and what can we use with D3? Broadly speaking, data is structured information with potential for meaning. In the context of programming for visualization, data is stored in a digital file, typically in either text or binary form. Within the scope of D3 and browser-based visualization, however, we will limit ourselves to text-based data.