
Ngram Viewer.
SNA. Java. Fouille du web. Scraping. CrawlProtect, le protecteur de votre site internet. Pourquoi utiliser CrawlProtect?
En tant que webmaster, une de vos plus grande peur est certainement de découvrir un jour que votre site a été hacké. Le risque de perdre vos données, votre référencement et/ou vos clients est important si votre site tombe à la merci d'un pirate malveillant. Bien sûr vous êtes vigilant, veillez à mettre à jour régulièrement les scripts que vous utilisez et choisissez toujours des mots de passes suffisamment compliqués.
Le PC que vous utilisez pour transférer vos fichiers est équipé d'un antivirus à jour, vous ne vous connectez pas en ftp à partir d'un poste public (cybercafé par exemple). En résumé, vous appliquez les règles de bon sens pour limiter les risques de piratage. Comme tout système de protection, CrawlProtect ne peut pas garantir que votre site ne sera jamais hacké, mais c'est un barrage supplémentaire à passer pour les hackers. Quel sont les risques d'un piratage? Yahoo! Pipes - Create a web scrapper. Yahoo!
Recently released1 a new Fetch Page module which dramatically increases the number of useful things that Pipes can do. With this new "pipe input" module we're no longer restricted to working with well-organised data sets in supported formats such as CSV, RSS, Atom, XML, JSON, iCal or KML. Now we can grab any HTML page we like and use the power of the Regex module to slice and dice the raw text into shape. In a nutshell, the Fetch Page module turns Yahoo! Pipes into a fully fledged web scraping2 IDE! As it happens, I already have a web scraping project which has been broken for some time now. The Task at Hand My web hosting provider (LunarPages3 - affiliate link alert!) So, what will this entail? Looking at the first page5 of the Server Information board, I can get most of the information I need from here. For the content of each item in the feed, I'll have to follow the link to the topic and extract the content of the first post. Starting the Pipe It's time to head on over to Yahoo!
Mining Data-text-web. Wrangler. UPDATE: The Stanford/Berkeley Wrangler research project is complete, and the software is no longer actively supported.
Instead, we have started a commercial venture, Trifacta. For the most recent version of the tool, see the free Trifacta Wrangler. Why wrangle? Too much time is spent manipulating data just to get analysis and visualization tools to read it. Wrangler is designed to accelerate this process: spend less time fighting with your data and more time learning from it. Google Refine.
The Best Tools for Visualization. Visualization is a technique to graphically represent sets of data.
When data is large or abstract, visualization can help make the data easier to read or understand. There are visualization tools for search, music, networks, online communities, and almost anything else you can think of. Whether you want a desktop application or a web-based tool, there are many specific tools are available on the web that let you visualize all kinds of data. Here are some of the best: Visualize Social Networks Last.Forward: Thanks to Last.fm's new widget gallery, you can now explore a wide selection of extras to extend your Last.fm experience. Last Forward Friends Sociomap: Friends Sociomap is another Last.fm tools that generates a map of the music compatibility between you and your Last.fm friends.
Fidg't: Fidg't is a desktop application that gives you a way to view your networks tagging habits. Fidg't The Digg Tools: Protovis. Protovis composes custom views of data with simple marks such as bars and dots.
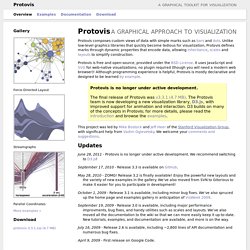
Unlike low-level graphics libraries that quickly become tedious for visualization, Protovis defines marks through dynamic properties that encode data, allowing inheritance, scales and layouts to simplify construction. Protovis is free and open-source, provided under the BSD License. It uses JavaScript and SVG for web-native visualizations; no plugin required (though you will need a modern web browser)! Although programming experience is helpful, Protovis is mostly declarative and designed to be learned by example.
Protovis is no longer under active development.The final release of Protovis was v3.3.1 (4.7 MB). This project was led by Mike Bostock and Jeff Heer of the Stanford Visualization Group, with significant help from Vadim Ogievetsky. Updates. Data Visualization Review: Gephi, Free Graph Exploration Software. I do not often get to play with networks, yet I find them fascinating and full of knowledge gathering potential.
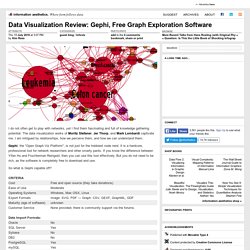
The data visualization works of Moritz Stefaner, Jer Thorp, and Mark Lombardi captivate me. I am intrigued by relationships, how we perceive them, and how we can understand them. Gephi, the "Open Graph Viz Platform", is not just for the hobbiest node nerd. It is a hardcore, professional tool for network researchers and other smarty pants. If you know the difference between Yifan Hu and Fruchterman Reingold, then you can use this tool effectively. So what is Gephi capable off? Gephi interface displaying airline traffic data. Pros — Options! Data Tools.