
Outcomes Star homelessness. Www.homelessoutcomes.org.uk/resources/1/Outcomes Manuals 2nd Ed/Star_organisation_guide_2ndEd.pdf. Www.homelessoutcomes.org.uk/resources/1/OutcomesStar/OutcomesStar.pdf. Dementia Survey. IMH Blog (Nottingham) Statistics: An Introduction. Writing@CSU Guide Statistics is a set of tools used to organize and analyze data.

Data must either be numeric in origin or transformed by researchers into numbers. For instance, statistics could be used to analyze percentage scores English students receive on a grammar test: the percentage scores ranging from 0 to 100 are already in numeric form. Statistics could also be used to analyze grades on an essay by assigning numeric values to the letter grades, e.g., A=4, B=3, C=2, D=1, and F=0. Employing statistics serves two purposes, (1) description and (2) prediction. VAS Generator. Graphs. Social Research Methods/Indexes, Scales, Typologies. Indices, Scales and Typologies Quantitative data analysis requires the construction of two types of measures of variables--indices and scales.

These measures are frequently used and are important since social scientists often study variables that possess no clear and unambiguous indicators--for instance, age or gender. Researchers often centralize much of work in regards to the attitudes and orientations of a group of people, which require several items to provide indication of the variables. Secondly, researchers seek to establish ordinal categories from very low to very high (vice-versa), which single data items can not ensure, while an index or scale can. Although they exhibit differences (which will later be discussed) the two have in common various factors. Are ordinal measures of variablescan order the units of analysis in terms of specific variablesare composite measures of variables (measurements based on more than one one data item) Index Construction[edit] Scales Sampling.
Sample Size Calculator - Confidence Level, Confidence Interval, Sample Size, Population Size, Relevant Population - Creative Research Systems. This Sample Size Calculator is presented as a public service of Creative Research Systems survey software.

You can use it to determine how many people you need to interview in order to get results that reflect the target population as precisely as needed. You can also find the level of precision you have in an existing sample. A Beginner's Guide to Mean, Median and Mode. An average summarises a group of numbers.

There are three main types of averages: mean, median and mode. Each of these will be looked at in turn. Mean This is the most commonly used average. The mean is calculated by adding up the numbers in a sample and dividing that answer by the sample size. Coefficient of determination (r-squared) - For Linear Regressions. Survey Design - How to Begin your Survey Design Project - Creative Research Systems.
Knowing what the client wants is the key factor to success in any type of business.

News media, government agencies and political candidates need to know what the public thinks. Associations need to know what their members want. Large companies need to measure the attitudes of their employees. The best way to find this information is to conduct a survey. This chapter is intended primarily for those who are new to survey research. This page covers the first five steps. Establishing Goals The first step in any survey is deciding what you want to learn. The potential market for a new product or service Ratings of current products or services Employee attitudes Customer/patient satisfaction levels Reader/viewer/listener opinions Association member opinions Opinions about political candidates or issues Corporate images. INTRODUCING STATISTICS. What is the difference between categorical, ordinal and interval variables? What is the difference between categorical, ordinal and interval variables?

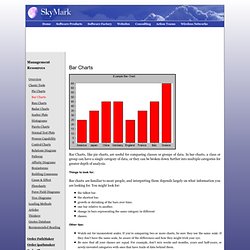
In talking about variables, sometimes you hear variables being described as categorical (or sometimes nominal), or ordinal, or interval. Below we will define these terms and explain why they are important. Categorical A categorical variable (sometimes called a nominal variable) is one that has two or more categories, but there is no intrinsic ordering to the categories. For example, gender is a categorical variable having two categories (male and female) and there is no intrinsic ordering to the categories. Understanding the p-value - Statistics Help. Bar charts are easy to use, and easy to abuse. Know the difference. Bar Charts, like pie charts, are useful for comparing classes or groups of data.

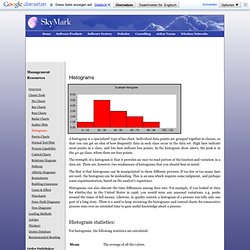
In bar charts, a class or group can have a single category of data, or they can be broken down further into multiple categories for greater depth of analysis. Things to look for: Bar charts are familiar to most people, and interpreting them depends largely on what information you are looking for. You might look for: Histograms: Snapshots of Process Variation. Histograms A histogram is a specialized type of bar chart.

Individual data points are grouped together in classes, so that you can get an idea of how frequently data in each class occur in the data set. High bars indicate more points in a class, and low bars indicate less points. In the histogram show above, the peak is in the 40-49 class, where there are four points.