
Data Visualization and Infographics Resources - Smashing Magazine. Advertisement Data visualizations and infographics can make complex datasets easier to understand and comprehend.

By creating a graphical represenatation of data and statistics, complicated concepts and information can make more sense in less time. Many visualizations focus on representing a specific set of data or statistical information. Others focus on less-concrete topics, providing a visual representation of abstract concepts. Generally speaking, the first type appear more like graphs or charts and the latter are often more creative and imaginative. But visualizations and infographics can be used poorly, too.
Also consider our previous articles: Data Visualizations and Infographics which lists examples and types of infographics and data visualizations.Data Visualization: Modern Approaches showcases modern examples of data visualization and infographics. 1. Strange Maps Strange Maps features only map-based graphics, both modern and historical. Wall Stats Visual Complexity Cool Infographics. Making of Urban Plaza. 592 Flares Facebook 0 Twitter 48 Pin It Share 439 499 Google+ 52 LinkedIn 50 inShare0 StumbleUpon 3 Reddit 0 592 Flares × I came to know Jeremy Kay and his work following a comment he made on the Hand Made by MATERICA D_SIGN post.

I immediately liked his hybrid approach and style of visualization, using SketchUP as the modeling tool and then doing all the rest within Photoshop in a painterly kind of way. Visiting his portfolio I find that his images have a unique look and feel to them, and I asked him to share his process of creating one of them. You’ll find that this approach, done right, offers fast production times with a lot of flexibility and freedom in the creation process.
You don’t even need much to start with to get a great result coming out, and you can easily develop a style of your own that will differentiate your visuals from all others out there. Most of my illustrations usually occur during the early phases of design. This is the end result… two original size crops from it… 30 Superb Examples of Infographic Maps. As you search the web you’ll come across a wide range of interactive and graphical maps.

Deciding when, where and how to integrate or display a map on your site is the first step, the second should be what technology and illustrations to use. If you’re all about interaction, JQuery, Ajax, or Flash are all effective technologies that hold their own ground. Map illustrations are a dime a dozen however, a strong and balanced display of graphics, information, and colors is what makes an infographic stand out and reach its target audience effectively.
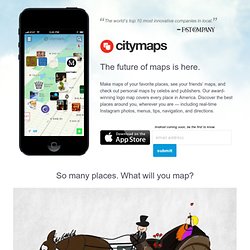
As designers, we’re constantly searching for ways to improve and style our designs, this is exactly what the following 30 infographics and sites display below; the breaking of rules. Sites with Interactive Maps Illustrative Infographics Compiled exclusively for WDD by Liz Fulghum. Did we miss any great examples? A visual exploration on mapping complex networks. Find New York Restaurants, Bars, Hotels, Shopping, Movies, Deals, Parking and more. Make maps of your favorite places, see your friends’ maps, and check out personal maps by celebs and publishers.

Our award-winning logo map covers every place in America. Discover the best places around you, wherever you are — including real-time Instagram photos, menus, tips, navigation, and directions.