
Forecasting: principles and practice. Recommendation System in R. Recommender systems are used to predict the best products to offer to customers.
These babies have become extremely popular in virtually every single industry, helping customers find products they'll like. Most people are familiar with the idea, but nearly everyone is exposed to several forms of personalized offers and recommendations each day (Google search ads being among the biggest source). Building recommendation systems is part science, part art, and many have become extremely sophisticated. Compare Server Plans. Www.diygenius. Business Intelligence Analytics Software & Data Visualization. Types of Charts and Graphs: Choosing the Best Chart. You’ve got your data, you’ve made some sense of it, and now it is time to communicate your results.
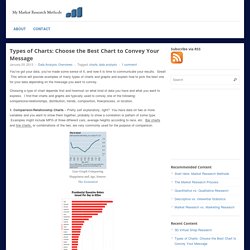
Great! This article will provide examples of many types of charts and graphs and explain how to pick the best one for your data depending on the message you want to convey. Choosing a type of chart depends first and foremost on what kind of data you have and what you want to express. I find that charts and graphs are typically used to convey one of the following: comparisons/relationships, distribution, trends, composition, flow/process, or location. 1.
Bar Chart Comparing Presidents and Executive Orders, Source: I Love Charts. Metronic - Responsive Admin Dashboard Template. Unemployment in the U.S. - Google Public Data Explorer. Understanding Full-Text Indexing in SQL Server. Full-text indexing in SQL Server has been quietly improving as Microsoft have worked on it over the last few years, making this a good time to look at what it offers.
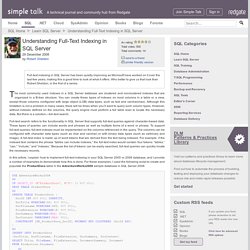
Who better to give us that look than Robert Sheldon, in the first of a series. The most commonly used indexes in a SQL Server database are clustered and nonclustered indexes that are organized in a B-tree structure. You can create these types of indexes on most columns in a table or a view, except those columns configured with large object (LOB) data types, such as text and varchar(max). Although this limitation is not a problem in many cases, there will be times when you’ll want to query such column types.
However, without indexes defined on the columns, the query engine must perform a full table scan to locate the necessary data. Full-text search refers to the functionality in SQL Server that supports full-text queries against character-based data. Senseful Solutions: Format Text as a Table. T sql - SQL Server Full-Text Search: combining proximity term and thesaurus. I do not believe that is a supported feature of SQL Server full text searching.
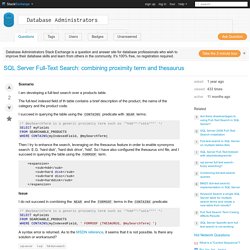
That would require a wildcard resolution to words and then a thesaurus lookup of each matching word to gather the thesaurus terms. This basically maps to a pretty complex query: some one of a group of prefixed words is very near to some one of another group of prefixed words which all then go through a thesaurus lookup to provide even more words. Based on previous experience, that is just not supported. (I see online that you have asked this elsewhere in the last few months, but without any answers, so I hope that this helps.) Search for Words Close to Another Word with NEAR. Should I use a #temp table or a @table variable? Introduction to Information Retrieval. This is the companion website for the following book.
Christopher D. Manning, Prabhakar Raghavan and Hinrich Schütze, Introduction to Information Retrieval, Cambridge University Press. 2008. You can order this book at CUP, at your local bookstore or on the internet. Graph Family. Comprehensive guide for Data Exploration in R. Export A Large Access Table/Query To Excel ~ My Engineering World. The previous days I had to update a large Access database.
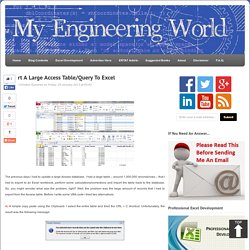
I had a large table – around 1.000.000 records/rows – that I had to export to an Excel workbook, perform some calculations/corrections and import the table back to the database. So, you might wonder what was the problem, right? Well, the problem was the large amount of records that I had to export from the Access table. Sql [charlist] wildcards. Kepion Partner Program. Kepion works closely with all partners as an extension of our team.
We believe in partners providing the best expertise needed around what the customer needs to compete and grow. Kepion Partners represent a diverse range of solutions, services and geographies. We have aligned with leading technology and implementation partners that have the right expertise and experience. Together we build sustainable and faster BI & Performance Management solutions for their business. With the Kepion Partner Program, your company benefits from the most flexible BI and Performance Management solution enabled for you to build solutions around the way your customers work. Kepion Partner Types Alliance Partners. Blockspring for Google Sheets – Blockspring.
We are excited to announce that all 1000+ functions on Blockspring can now be run from your spreadsheet.
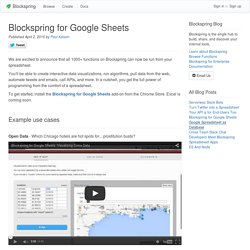
You'll be able to create interactive data visualizations, run algorithms, pull data from the web, automate tweets and emails, call APIs, and more. In a nutshell, you get the full power of programming from the comfort of a spreadsheet. To get started, install the Blockspring for Google Sheets add-on from the Chrome Store. Programming for Data Science the Polyglot approach: Python + R + SQL. Guest blog post by ajit jaokar In this post, I discuss a possible new approach to teaching Programming for Data Science.
Programming for Data Science is focussed on the R vs. Python question. Everyone seems to have a view including the venerable Nature journal (Programming – Pick up Python). Here, I argue that we look beyond Python vs. D3.js Resources to Level Up. I have gotten a lot better at D3.js development over the past few years, and can trace most of my improvement to coming across a few key tutorials, blogs, books and other resources on the topic.
They’ve been a huge help for me, and I’ve gathered a bunch of my favorites in this post to hopefully help others improve their D3 experience. Here it goes: Assessing your level First, let’s define four general D3.js levels: Complete Beginner: You have no previous experience with D3.js or any front end technologies (HTML/CSS).Basic: You have some HTML/CSS/JS skills and have played around with some D3.js examples, but don’t completely understand the patterns and mechanics it uses.Intermediate You know how to customize D3.js graphs using examples found in search engines, but you struggle to reuse them and aren’t quite happy with the quality of the code itself.Proficient: You have build a lot of different graphs, tests and integrated them with different technologies or libraries.
Complete Beginner Books. Forecasting: principles and practice. Welcome to our online textbook on forecasting. This textbook is intended to provide a comprehensive introduction to forecasting methods and to present enough information about each method for readers to be able to use them sensibly. We don’t attempt to give a thorough discussion of the theoretical details behind each method, although the references at the end of each chapter will fill in many of those details. The book is written for three audiences: (1) people finding themselves doing forecasting in business when they may not have had any formal training in the area; (2) undergraduate students studying business; (3) MBA students doing a forecasting elective.
We use it ourselves for a second-year subject for students undertaking a Bachelor of Commerce degree at Monash University, Australia. How To Use Microsoft Excel to Visualize Hadoop Data - Hortonworks. D3.js Resources to Level Up. CSV To SQL Converter. Convert CSV to SQL Use this tool to convert CSV to SQL statements. From CSV To CSV/Excel Data Tools What can this tool do? INSERT, UPDATE, DELETE, MERGE, and SELECT statements can be created. What are my options? Duet Project Management. Data Everywhere - Share Spreadsheet Data. Metronic - Responsive Admin Dashboard Template.
21 tools that will help your remote team work better together - Page 20 of 20. Meldium Securely sharing passwords with people in your team across the Internet is no easy feat. Getting your team on Meldium means you have control over who has access to what and passwords are never exposed to team members. Instead, Meldium offers single sign-on so they can log in with one click without ever seeing the actual password. Meldium works with Internet Explorer, Firefox, Chrome, iOS and Android.