
Realtime Visualizations w/ D3 and Backbone. CodeFlower Source code visualization. This experiment visualizes source repositories using an interactive tree.
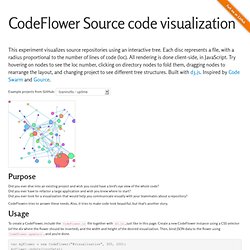
Each disc represents a file, with a radius proportional to the number of lines of code (loc). All rendering is done client-side, in JavaScript. Try hovering on nodes to see the loc number, clicking on directory nodes to fold them, dragging nodes to rearrange the layout, and changing project to see different tree structures. Built with d3.js. Inspired by Code Swarm and Gource.
Purpose Did you ever dive into an existing project and wish you could have a bird's eye view of the whole code? CodeFlowers tries to answer these needs. Usage To create a CodeFlower, include the CodeFlower.js file together with d3.js, just like in this page. Var myFlower = new CodeFlower("#visualization", 300, 200); myflower.update(jsonData); Input data format The jsonData format taken as input to update() is extremely simple. Generating JSON for a project It's easy to generate loc metrics for any project, whatever the language. Licence. Home · metormote/iopctrl Wiki. More Data Visualization Libraries Based on D3.JS - Mike McDearmon. There are a lot of ways to visualize data on the Web (with more emerging every day), but the flexibility, versatility, and energized development community surrounding D3.js makes it a great option to explore.
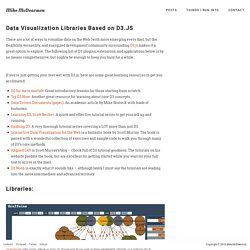
The following list of D3 plugins, extensions, and applications below is by no means comprehensive, but oughta be enough to keep you busy for a while. If you’re just getting your feet wet with D3.js, here are some great learning resources to get you acclimated:D3 for mere mortals: Great introductory lessons for those starting from scratch.Try D3 Now: Another great resource for learning about core D3 concepts.Data-Driven Documents (paper): An academic article by Mike Bostock with loads of footnotes.Learning D3, Scott Becker: A quick and effective tutorial series to get yourself up and running.Dashing D3: A very thorough tutorial series covering a LOT more than just D3.Interactive Data Visualization for the Web is a fantastic book by Scott Murray.
Cubism.js. Time Series Visualization foo7.6 bar−6.2 foo + bar1.4 foo - bar14 Cubism.js is a D3 plugin for visualizing time series.
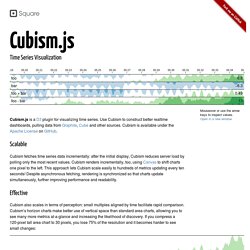
Scalable Cubism fetches time series data incrementally: after the initial display, Cubism reduces server load by polling only the most recent values. Effective Cubism also scales in terms of perception: small multiples aligned by time facilitate rapid comparison. Area (120px)7.6 Area (30px)7.6. Gallery · mbostock/d3 Wiki. Wiki ▸ Gallery Welcome to the D3 gallery!

More examples are available for forking on Observable; see D3’s profile and the visualization collection. Please share your work on Observable, or tweet us a link! Visual Index. Home · mbostock/d3 Wiki. Stanford Vis Group: d3.js - Data Driven Documents. D3 Tree. Climbing the d3.js Visualisation Stack. Over the last few months, the d3.js Javascript visualisation library has seen widespread use as the powerhouse behind a wide variety of highly effective interactive data visualisations.
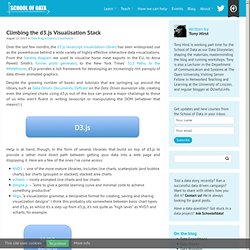
From the Sankey diagram we used to visualise horse meat exports in the EU, to Anna Powell Smith’s funnel plots generator, to the New York Times’ 512 Paths to the Whitehouse, d3.js provides a rich framework for developing an increasingly rich panoply of data driven animated graphics. Despite the growing number of books and tutorials that are springing up around the library, such as Data-Driven Documents, Defined on the Data Driven Journalism site, creating even the simplest charts using d3.js out of the box can prove a major challenge to those of us who aren’t fluent in writing Javascript or manipulating the DOM (whatever that means! ;-) Further up the abstraction layer, we have more specialised Javascript libraries that provide support for complex or compound chart types: So – what are you waiting for…?