
Download. Choose your operating system: TheBrain 8 for Mac OS X Mac OS 10.7+1 GHz Intel Processor, 1GB RAM, 100 MB available storage TheBrain 8 for Linux Works on many Linux/Unix variants.

Verified on Ubuntu, Red Hat, Fedora, Solaris, and SUSE.We are unable to support all installations of TheBrain for Linux due to the number of possible unique configurations and low number of users.1 GHz CPU, 1GB RAM, 100 MB available storage Archive format without an installer (For experts only) TheBrain for iOS TheBrain for iOS is a native app for iPad, iPhone, and iPod TouchAccess your Brain on your iOS device, on the Web and from your desktop computer with TheBrain Cloud ServicesLearn more about TheBrain for iOS. TheBrain for Android TheBrain for Android is a native app for Android devices.Access your Brain on your Android device, on the Web and from your desktop computer with TheBrain Cloud ServicesLearn more about TheBrain for Android.
How the Free Download Works Getting Started with TheBrain. Make Your Own Infographic. Infographics are to data what storytelling is to an annual report: a more engaging way to help bring attention and understanding to your nonprofit’s cause.
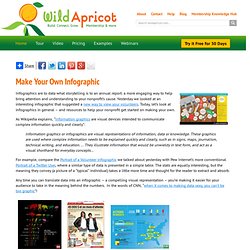
Yesterday we looked at an interesting infographic that suggested a new way to view your volunteers. Today, let’s look at infographics in general – and resources to help your nonprofit get started on making your own. As Wikipedia explains, “Information graphics are visual devices intended to communicate complex information quickly and clearly”: Information graphics or infographics are visual representations of information, data or knowledge. These graphics are used where complex information needs to be explained quickly and clearly, such as in signs, maps, journalism, technical writing, and education. ... For example, compare the Portrait of a Volunteer infographic we talked about yesterday with Pew Internet’s more conventional Portrait of a Twitter User, where a similar type of data is presented in a simple table.
How To Create Outstanding Modern Infographics. In this tutorial you will learn that data doesn't have to be boring, it can be beautiful!

Learn how to use various graph tools, illustration techniques and typography to make an accurate and inspiring infographic in Adobe Illustrator. Start by using the Rectangle Tool (M) to draw a shape. Give it a subtle radial gradient too. The entire design is based on a grid of four columns. To make the columns first select the rectangle and drag a guide onto the centre of the shape. Condense the shape so it fits within the left-most guide and centre guide. Move the shape over to the right and add another guide to the centre here. Using the Rectangle Tool (M) draw a thin white box on the centre line that will be the width of the gap between the columns.
Repeat the process for the other columns with your final result being below. I like to place the most important graphics first and work-in the ancillary charts and graphs afterwards. Give the circles a variety of gradients. That's it! 10 Awesome Free Tools To Make Infographics. Advertisement Who can resist a colourful, thoughtful venn diagram anyway?

In terms of blogging success, infographics are far more likely to be shared than your average blog post. This means more eyeballs on your important information, more people rallying for your cause, more backlinks and more visits to your blog. In short, a quality infographic done well could be what your blog needs right now. Designing An Infographic Some great tips for designing infographics: Keep it simple! Ideas for infographic formats include: Timelines;Flow charts;Annotated maps;Graphs;Venn diagrams;Size comparisons;Showing familiar objects or similar size or value.