
Seaborn: statistical data visualization — seaborn 0.7.0 documentation. Choose the right chart for your data with this tool. Credit: Screenshot of the 'Essentials' chart choosing resource.
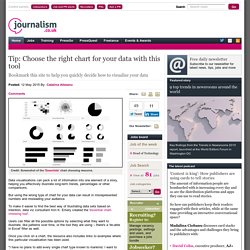
Data visualisations can pack a lot of information into one element of a story, helping you effectively illustrate long-term trends, percentages or other comparisons. But using the wrong type of chart for your data can result in misrepresented numbers and misleading your audience. To make it easier to find the best way of illustrating data sets based on intention, data viz consultant Ann K. Emery created the 'essential chart-choosing tool'. Users can filter all the possible options by selecting what they want to illustrate, like patterns over time, or the tool they are using – there's a 'do-able in Excel' filter as well. Once you click on a chart, the resource also includes links to examples where this particular visualisation has been used. "I have no plans to add every single chart type known to mankind. Big Data Exploration, Visualization, Analytics.
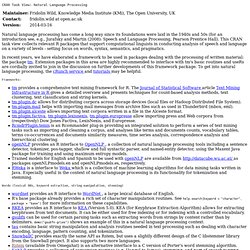
D3.js - Data-Driven Documents. 20+ Tools to Create Your Own Infographics. A picture is worth a thousand words – based on this, infographics would carry hundreds of thousands of words, yet if you let a reader choose between a full-length 1000-word article and an infographic that needs a few scroll-downs, they’d probably prefer absorbing information straight from the infographic. What’s not to like? Colored charts and illustrations deliver connections better than tables and figures and as users spend time looking back and forth the full infographic, they stay on the site longer. Plus, readers who like what they see are more likely to share visual guides more than articles. While not everyone can make infographics from scratch, there are tools available on the Web that will help you create your very own infographics.
In this article, we’re listing more than 20 such options to help you get your messages across to your readers, visually. Read Also: The Infographic Revolution: Where Do We Go From Here? What About Me? “What About Me?” Vizualize.me Piktochart. Natural Language Processing. Natural language processing has come a long way since its foundations were laid in the 1940s and 50s (for an introduction see, e.g., Jurafsky and Martin (2008): Speech and Language Processing, Pearson Prentice Hall).
This CRAN task view collects relevant R packages that support computational linguists in conducting analysis of speech and language on a variety of levels - setting focus on words, syntax, semantics, and pragmatics. In recent years, we have elaborated a framework to be used in packages dealing with the processing of written material: the package tm. Extension packages in this area are highly recommended to interface with tm's basic routines and useRs are cordially invited to join in the discussion on further developments of this framework package. To get into natural language processing, the cRunch service and tutorials may be helpful.
Frameworks: tm provides a comprehensive text mining framework for R. Visual Thinking Archive. A Periodic Table of Visualization Methods. Over 100 Incredible Infographic Tools and Resources (Categorized)
This post is #6 in DailyTekk’s famous Top 100 series which explores the best startups, gadgets, apps, websites and services in a given category.

Total items listed: 112. Time to compile: 8+ hours. Follow @DailyTekk on Twitter to make sure you don’t miss a week! Update: Be sure to check out our latest post on infographics: Infographics Are Everywhere – Here’s How to Make Yours Go Viral. I love a good infographic! Data Visualization: 20+ Useful Tools and Resources. There are plenty of cool technologies available to collect and examine data.
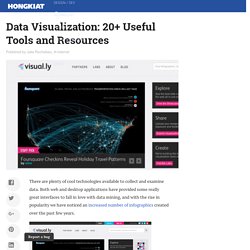
Both web and desktop applications have provided some really great interfaces to fall in love with data mining, and with the rise in popularity we have noticed an increased number of infographics created over the past few years. Today we’ll be looking into some really cool and popular online resources for data visualization. You can see all kinds of data like human population, world condition and even human emotion presented via the visualization. While some of the visualization might be experimental, all of them have one similarity: they help you understand the data better, and this is exactly what visualization is for. If you’ve designed your own infographic or visualization tool we’d love to check it out. Recommended Reading: More Infographic related posts. Better World Flux Now this is one beautiful visualization tool! The refined condition of BWF’s design comes as no surprise. Visual.ly. Data visualisation and Infographics tools.
Think BigIngestion and Streaming with Storm, Kafka, and Flume. Flume Flume is distributed system for collecting log data from many sources, aggregating it, and writing it to HDFS.
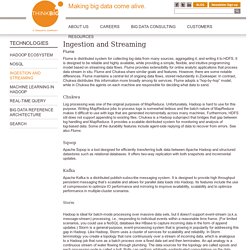
It is designed to be reliable and highly available, while providing a simple, flexible, and intuitive programming model based on streaming data flows. Flume provides extensibility for online analytic applications that process data stream in situ. Flume and Chukwa share similar goals and features. However, there are some notable differences. Data Visualization with D3.js. The Miso Project.