
Visualizing Trees. Ggtree. Making fast, good decisions with the FFTrees R package. “…[W]e are suspicious of rapid cognition.
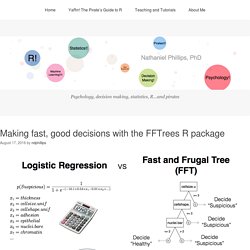
We live in a world that assumes that the quality of a decision is directly related to the time and effort that went into making it.” ~ Malcolm Gladwell In his book Blink, Malcolm Gladwell summarises a common misconception about good decision making. According to folk wisdom, the more time, information, and effort you put into a decision, the better it gets. In other words, “More is better.” If you are a doctor making a diagnosis, more medical tests are always better. However, decades of research in cognitive science and machine learning have shown that the “More is better” theory is, in many real-world decisions, flat wrong. What simple decision rules can people use to make good decisions? While fast and frugal trees have shown promise, there are currently no off-the-shelf methods to create them. The FFTrees package in action You can install and load the FFTrees package from CRAN: There’s one of our fast and frugal trees! Performance Summary. RPubs - Math riddle.
A Complete Tutorial on Tree Based Modeling from Scratch (in R & Python) Introduction Tree based learning algorithms are considered to be one of the best and mostly used supervised learning methods.

Tree based methods empower predictive models with high accuracy, stability and ease of interpretation. Unlike linear models, they map non-linear relationships quite well. They are adaptable at solving any kind of problem at hand (classification or regression). Methods like decision trees, random forest, gradient boosting are being popularly used in all kinds of data science problems. This tutorial is meant to help beginners learn tree based modeling from scratch. Note: This tutorial requires no prior knowledge of machine learning. Table of Contents. R data.tree 0.3 "Apple Tree" on CRAN: Now with tree plot! - ipub. In Celtic mythology, the apple tree is a symbol for fruitfulness.
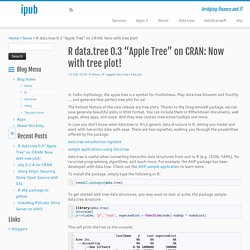
May data.tree blossom and fructify … and generate that perfect tree plot for us! The hottest feature of the new release are tree plots: Thanks to the DiagrammeR package, we can now generate beautiful plots in html format. You can include them in RMarkdown documents, web pages, shiny apps, and more. Label edge number in ggtree · G. Yu. Jan 13, 2016 · 1 minute read · 0 Comments Rggtree 3 0Sina0 0 This is a question from ggtree user.
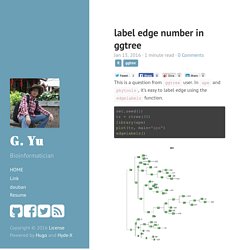
In ape and phytools, it’s easy to label edge using the edgelabels function. set.seed(1) tr = rtree(30) library(ape)plot(tr, main="ape")edgelabels() I don’t see any necessity to label edge numbers, as they are meaningless. The number is labeled as the row index of tr$edge, and edge can be uniquely mapped to child node. Using C4.5 to predict Diabetes in Pima Indian Women. C4.5 is an algorithm used to generate a decision tree developed by Ross Quinlan in 1993.

C4.5 is an extension of Quinlan's earlier ID3 algorithm. The decision trees generated by C4.5 can be used for classification, and for this reason, C4.5 is often referred to as a statistical classifier. Today, I will use C4.5 algorithm to predict Diabetes in Pima Indian Women. Meet the dataset A population of women who were at least 21 years old, of Pima Indian heritage and living near Phoenix, Arizona, was tested for diabetes according to World Health Organization criteria. Load the dataset Training data contains 7 numerical variables (npreg, glu, bp, skin, bmi, ped, age) and a categorical variable (type).
Fit the model We now use caret package to fit model to the data set. An example of drawing beast tree using ggtree. Posted by ygc on April 1, 2015.
[ggtree] updating a tree view using %<% operator. Posted by ygc on February 10, 2015 I am very exciting that I have received very positive feedback from Ahmed Moustafa and Simon Frost. ggtree now has equipped with a lot of new features.
![[ggtree] updating a tree view using %<% operator](http://cdn.pearltrees.com/s/pic/th/ggtree-updating-using-operator-101692887)
This time, I would like to introduce the replace operator, %<%. Suppose we have build a tree view using ggtree with multiple layers, we don't need to run the code again to build a new tree view with another tree. A First Look at rxDForest() By Joseph RIckert Last July, I blogged about rxDTree() the RevoScaleR function for building classification and regression trees on very large data sets.
As I explaned then, this function is an implementation of the algorithm introduced by Ben-Haim and Yom-Tov in their 2010 paper that builds trees on histograms of data and not on the raw data itself. This algorithm is designed for parallel and distributed computing. Consequently, rxDTree() provides the best performance when it is running on a cluster: either an Microsoft HPC cluster or a Linux LSF cluster. rxDForest() (new with Revolution R Enterprise 7.0) uses rxDTree() to take the next logical step and implement a random forest type algorithm for building both classification and regression forests. <font color="#FF6B6B">Visualizing</font> <font color="#4ECDC4">Dendrograms</font> <font color="#556270">in R</font> 7+ ways to plot dendrograms in R. Ggplot2 - ggdendro and color bars under the node leaves.
Interactive Heatmaps (and Dendrograms) – A Shiny App. Heatmaps are a great way to visualize data matrices.

Heatmap color and organization can be used to encode information about the data and metadata to help learn about the data at hand. An example of this could be looking at the raw data or hierarchically clustering samples and variables based on their similarity or differences. There are a variety packages and functions in R for creating heatmaps, including heatmap.2. I find pheatmap particularly useful for the relative ease in annotating the top of the heat map using an arbitrary number of items (the legend needs to be controlled for best effect, not implemented).