
Cluster Analysis in R » Unsupervised Approach » finnstats. Cluster Analysis in R, when we do data analytics, there are two kinds of approaches one is supervised and another is unsupervised.
Clustering is a method for finding subgroups of observations within a data set. When we are doing clustering, we need observations in the same group with similar patterns and observations in different groups to be dissimilar. If there is no response variable, then suitable for an unsupervised method, which implies that it seeks to find relationships between the n observations without being trained by a response variable. Clustering allows us to identify homogenous groups and categorize them from the dataset. One of the simplest clusterings is K-means, the most commonly used clustering method for splitting a dataset into a set of n groups. If datasets contain no response variable and with many variables then it comes under an unsupervised approach. Rank order analysis in R.
AweSOM. The aweSOM package aweSOM offers a set of tools to explore and analyze datasets with Self-Organizing Maps (SOM, also known as Kohonen maps), a form of artificial neural network originally created by Teuvo Kohonen in the 1980s.
The package introduces interactive plots, making analysis of the SOM easier. aweSOM can be used either through the web-based interface (called by aweSOM()) or through the command-line functions that are detailed here. The interface also produces reproducible R code, which closely resembles the scripts below. This vignette details some of the most important functions of the aweSOM package, along with the workflow of training a SOM (using the kohonen package), assessing its quality measures and visualizing the SOM along with its superclasses. Importing data and training a SOM For the purpose of this example, we will train a 4x4 hexagonal SOM on the famous iris dataset. How to use hierarchical cluster analysis on time series data - Storybench. Which cities have experienced similar patterns in violent crime rates over time?
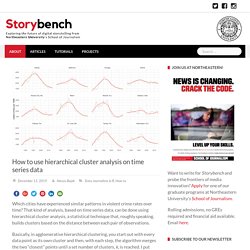
That kind of analysis, based on time series data, can be done using hierarchical cluster analysis, a statistical technique that, roughly speaking, builds clusters based on the distance between each pair of observations. Basically, in agglomerative hierarchical clustering, you start out with every data point as its own cluster and then, with each step, the algorithm merges the two “closest” points until a set number of clusters, k, is reached. I put closest in quotation marks because there are various ways to measure this distance – Euclidean distance, Manhattan distance, correlation distance, maximum distance and more. I’ve found this post and this post to be helpful in explaining those. For the purposes of this tutorial, we’ll use Ward’s method, which “minimizes the total within-cluster variance. Load packages and data Could one tease out the cities that follow similar patterns through cluster analysis?
10 Tips for Choosing the Optimal Number of Clusters. Using clusterlab to benchmark clustering algorithms – intobioinformatics. Exploring Assumptions of K-means Clustering using R – R-posts.com. K-Means Clustering is a well known technique based on unsupervised learning.
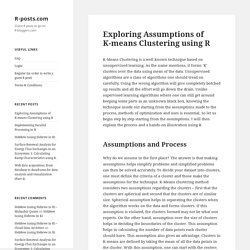
As the name mentions, it forms ‘K’ clusters over the data using mean of the data. Unsupervised algorithms are a class of algorithms one should tread on carefully. Using the wrong algorithm will give completely botched up results and all the effort will go down the drain. Unlike supervised learning algorithms where one can still get around keeping some parts as an unknown black box, knowing the technique inside out starting from the assumptions made to the process, methods of optimization and uses is essential. So let us begin step by step starting from the assumptions.
Assumptions and Process. Self-Organising Maps: An Introduction. About David: David Asboth is a Data Scientist with a software development background.
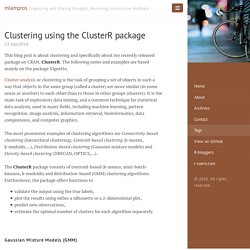
He's had many different job titles over the years, with a common theme: he solves human problems with computers and data. This post originally appeared on his blog, davidasboth.com Introduction When you learn about machine learning techniques, you usually get a selection of the usual suspects. Finding Optimal Number of Clusters. In this post we are going to have a look at one of the problems while applying clustering algorithms such as k-means and expectation maximization that is of determining the optimal number of clusters.
The problem of determining what will be the best value for the number of clusters is often not very clear from the data set itself. There are a couple of techniques we will walk-through in this post which one can use to help determine the best k-value for a given data set. library(readr) StudentKnowledgeData <- read_csv("YourdownloadFolderPath/StudentKnowledgeData.csv") View(StudentKnowledgeData) Pre-processing This dataset is comma-separated with a header line. Once we have done pre-processing to ensure the data is ready for further applications. Scaled_data = as.matrix(scale(myDataClean)) Clustering using the ClusterR package · mlampros. 12 Sep 2016 This blog post is about clustering and specifically about my recently released package on CRAN, ClusterR.
The following notes and examples are based mainly on the package Vignette. Finding the K in K-means by Parametric Bootstrap – Win-Vector Blog. Posted on Author Nina ZumelCategories data science, Exciting Techniques, Expository Writing, Mathematics, StatisticsTags Clustering, hypothesis testing, mixtools, parametric bootstrap, R, Shiny, unsupervised learning One of the trickier tasks in clustering is determining the appropriate number of clusters.
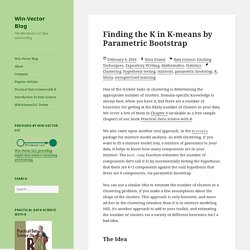
Domain-specific knowledge is always best, when you have it, but there are a number of heuristics for getting at the likely number of clusters in your data. We cover a few of them in Chapter 8 (available as a free sample chapter) of our book Practical Data Science with R. We also came upon another cool approach, in the mixtools package for mixture model analysis. Model-Based Clustering - Unsupervised Machine Learning. The traditional clustering methods such as hierarchical clustering and partitioning algorithms (k-means and others) are heuristic and are not based on formal models.
An alternative is to use model-based clustering, in which, the data are considered as coming from a distribution that is mixture of two or more components (i.e. clusters) (Chris Fraley and Adrian E. Raftery, 2002 and 2012). Each component k (i.e. group or cluster) is modeled by the normal or Gaussian distribution which is characterized by the parameters: : mean vector,: covariance matrix,An associated probability in the mixture. The Guide for Clustering Analysis on a Real Data: 4 steps you should know - Unsupervised Machine Learning. Human’s abilities are exceeded by the large amounts of data collected every day from different fields, bio-medical, security, marketing, web search, geo-spatial or other automatic equipment.
Consequently, unsupervised machine learning technics, such as clustering, are used for discovering knowledge from big data. Clustering approaches classify samples into groups (i.e clusters) containing objects of similar profiles. In our previous post, we clarified distance measures for assessing similarity between observations. DBSCAN: density-based clustering for discovering clusters in large datasets with noise - Unsupervised Machine Learning. Partitioning methods (K-means, PAM clustering) and hierarchical clustering are suitable for finding spherical-shaped clusters or convex clusters. In other words, they work well for compact and well separated clusters. Moreover, they are also severely affected by the presence of noise and outliers in the data. Unfortunately, real life data can contain: i) clusters of arbitrary shape such as those shown in the figure below (oval, linear and “S” shape clusters); ii) many outliers and noise. The figure below shows a dataset containing nonconvex clusters and outliers/noises.
Hybrid hierarchical k-means clustering for optimizing clustering outputs - Unsupervised Machine Learning. Clustering algorithms are used to split a dataset into several groups (i.e clusters), so that the objects in the same group are as similar as possible and the objects in different groups are as dissimilar as possible. Determining the optimal number of clusters: 3 must known methods - Unsupervised Machine Learning. Concept The gap statistic has been published by R. Tibshirani, G. Walther, and T. Hastie (Standford University, 2001).
The approach can be applied to any clustering method (K-means clustering, hierarchical clustering, …). The gap statistic compares the total within intracluster variation for different values of k with their expected values under null reference distribution of the data, i.e. a distribution with no obvious clustering. Recall that, the total within intra-cluster variation for a given k clusters is the total within sum of square (). The reference dataset is generated using Monte Carlo simulations of the sampling process. Note that, the function runif(n, min, max) can be used to generate random uniform distribution. Hierarchical Clustering Essentials - Unsupervised Machine Learning. There are two standard clustering strategies: partitioning methods (e.g., k-means and pam) and hierarchical clustering. Hierarchical clustering is an alternative approach to k-means clustering for identifying groups in the dataset.
It does not require to pre-specify the number of clusters to be generated. The result is a tree-based representation of the observations which is called a dendrogram. It uses pairwise distance matrix between observations as clustering criteria. In this article we provide: Using K-Means to cluster wine dataset. Recently, I joined Cluster Analysis course in coursera. The content of first week is about Partitioning-Based Clustering Methods where I learned about some cluster algorithms based on distance such as K-Means, K-Medians and K-Modes.
I would like to turn what I learn into practice so I write this post as an excercise of this course. In this post, I will use K-Means for clustering wine data set which I found in one of excellent posts about K-Mean in r-statistics website. The wine data set contains the results of a chemical analysis of wines grown in a specific area of Italy. Three types of wine are represented in the 178 samples, with the results of 13 chemical analyses recorded for each sample. K-means clustering is not a free lunch – Variance Explained. I recently came across this question on Cross Validated, and I thought it offered a great opportunity to use R and ggplot2 to explore, in depth, the assumptions underlying the k-means algorithm. The question, and my response, follow.
Hierarchical Clustering with R (feat. D3.js and Shiny) Everyday analytics: PCA and K-means Clustering of Delta Aircraft. Introduction I work in consulting. K-means Clustering (from “R in Action”) In R’s partitioning approach, observations are divided into K groups and reshuffled to form the most cohesive clusters possible according to a given criterion. There are two methods—K-means and partitioning around mediods (PAM).