
Angular.js Directives for nvd3.js and d3.js ~ pie chart ~ nvd3js d3js angularjs. How to create a basic chart Include angularjs-nvd3-directives.js in your HTML file.
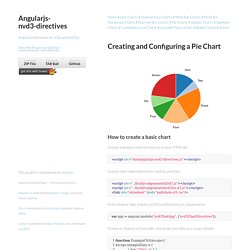
Include other dependencies for nvd3.js and d3.js. In the Angular App, include nvd3ChartDirectives as a dependency. var app = angular.module("nvd3TestApp", ['nvd3ChartDirectives']); Create an Angular.js Controller, and assign json data to a scope variable. D3.js - Data-Driven Documents. Data/high-level-reactivity.md at design-overview · meteor/data. Dev & Design. Flex Admin - Responsive Admin Template. Overview Up to date with Bootstrap 3.1!
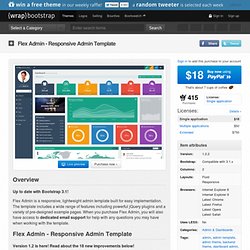
Flex Admin is a responsive, lightweight admin template built for easy implementation. The template includes a wide range of features including powerful jQuery plugins and a variety of pre-designed example pages. When you purchase Flex Admin, you will also have access to dedicated email support for help with any questions you may have when working with the template. Flex Admin - Responsive Admin Template Version 1.2 is here! Dedicated Email Support When purchasing Flex Admin, you will have access to dedicated email support. New in v1.2! Updated Dashboard UI with New Styles/FeaturesFlex UI Branded Logo and Navbar ImageNew Feature: Flex Tiles - Tile UI Style Content BoxesNew Feature: Custom Date/Time Widget Added (Changes depending on the time of day!) Featured Pages DashboardCalendarMailboxCompose MessageChat WidgetUser ProfileInvoicePricing TablesFAQ PageSearch ResultsLogin BasicLogin Social404 Error500 ErrorBlank Page Featured Plugins Update Log.
Gallery · mbostock/d3 Wiki. Wiki ▸ Gallery Welcome to the D3 gallery!

More examples are available for forking on Observable; see D3’s profile and the visualization collection. Please share your work on Observable, or tweet us a link! Visual Index Basic Charts Techniques, Interaction & Animation Maps Statistics Examples Collections. Introducing Resizer - Articles. An interactive viewer to see and test how digital products respond to material design breakpoints across desktop, mobile, and tablet.
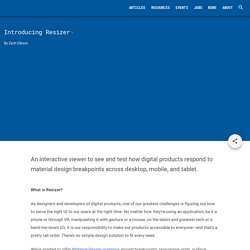
What is Resizer? As designers and developers of digital products, one of our greatest challenges is figuring out how to serve the right UI to our users at the right time. No matter how they’re using an application, be it a phone or through VR, manipulating it with gesture or a mouse, on the latest and greatest tech or a hand-me-down 2G, it is our responsibility to make our products accessible to everyone—and that’s a pretty tall order. There’s no simple design solution to fit every need. We’ve started to offer Material Design guidance around breakpoints, responsive grids, surface behaviors, and user interface patterns. With Resizer you can input a custom URL, or preview selected websites and demos.
Exploring UI Patterns Pesto Demo Pesto is a recipe app demonstrating a few responsive patterns. Shrine Demo. Jetweb.free.fr/nabaztag/Tutoriel_OJN_Win-b8177.pdf. Material Design for Bootstrap. Basic Panel <div class="panel panel-default"><div class="panel-body">A Basic Panel</div></div> Panel Heading.
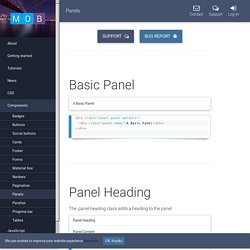
Material-UI. Rickshaw: A JavaScript toolkit for creating interactive time-series graphs. Graphing Toolkit Rickshaw provides the elements you need to create interactive graphs: renderers, legends, hovers, range selectors, etc.
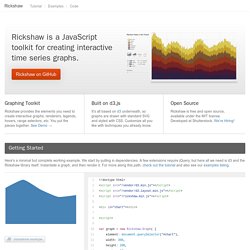
You put the pieces together. See Demo → Built on d3.js It's all based on d3 underneath, so graphs are drawn with standard SVG and styled with CSS. Open Source Rickshaw is free and open source, available under the MIT license. Getting Started Here's a minimal but complete working example. Area Graphs Lines Bars Scatterplot Interactive Legend Add a basic legend: Add functionality to toggle series' visibility on and off: Highlight each series on hover within the legend: SB Admin 2 - Free Bootstrap Admin Theme - Free Bootstrap Template. Template Improvements in Version 2: New and improved custom jQuery enabled sidebar menu.
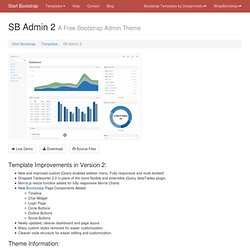
Fully responsive and multi-leveled! Dropped Tablesorter 2.0 in place of the more flexible and extensible jQuery dataTables plugin. Morris.js resize function added for fully responsive Morris Charts. New Bootsnipp Page Components Added: Timeline Chat Widget Login Page Circle Buttons Outline Buttons Social Buttons Newly updated, cleaner dashboard and page layout.
Tableaux de bord (dashboard) libre en temps réel ou pas. Vous avez peut-être besoin de suivre vos KPI et indicateurs que ce soit sur votre supervision, votre système de tickets ou tout autre donnée et statistiques.
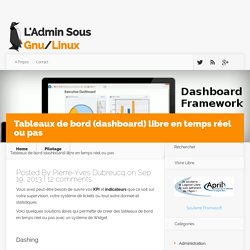
Voici quelques solutions libres qui permette de créer des tableaux de bord en temps réel ou pas avec un système de Widget. Dashing Dashing est un framework basé sur Sinatra qui permet de créer de jolie tableaux de bord Vous pouvez tester une démo ici. Ou là, optimisé pour un écran 1080p Fonctionnalités principales : Utilisation de widgets préfait ou il est possible de créer complétement ses propres widget avec un CSS, HTML et CoffescriptLes Widgets peuvent être relié à des données facilement.Utilisation d’une API pour pousser les données ou via ruby DSL pour récupérer les donnéesInterface Drag & Drop pour faciliter la réorganisation des données.Héberger votre dashboard avec Heroku en moins de 30 secondes Dashing dispose d’une liste de Widget assez impressionnant fournit entre autre pas les utilisateurs.
Tableaux de bord (dashboard) libre en temps réel ou pas. The Data Visualisation Catalogue.