
Axes (ggplot2) Axes and Text. Many high level plotting functions (plot, hist, boxplot, etc.) allow you to include axis and text options (as well as other graphical paramters).
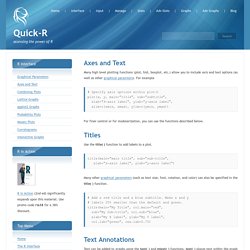
For example # Specify axis options within plot() plot(x, y, main="title", sub="subtitle", xlab="X-axis label", ylab="y-axix label", xlim=c(xmin, xmax), ylim=c(ymin, ymax)) For finer control or for modularization, you can use the functions described below. Titles Use the title( ) function to add labels to a plot. title(main="main title", sub="sub-title", xlab="x-axis label", ylab="y-axis label") Many other graphical parameters (such as text size, font, rotation, and color) can also be specified in the title( ) function. # Add a red title and a blue subtitle.
Text Annotations Text can be added to graphs using the text( ) and mtext( ) functions. text( ) places text within the graph while mtext( ) places text in one of the four margins. text(location, "text to place", pos, ...) mtext("text to place", side, line=n, ...) Cookbook for R » Cookbook for R.
Machine Learning Repository. Kite Graphs in R. The Work of Edward Tufte and Graphics Press. Edward Tufte is a statistician and artist, and Professor Emeritus of Political Science, Statistics, and Computer Science at Yale University.

He wrote, designed, and self-published 4 classic books on data visualization. The New York Times described ET as the "Leonardo da Vinci of data," and Business Week as the "Galileo of graphics. " He is now writing a book/film The Thinking Eye and constructing a 234-acre tree farm and sculpture park in northwest Connecticut, which will show his artworks and remain open space in perpetuity. He founded Graphics Press, ET Modern gallery/studio, and Hogpen Hill Farms LLC. Visual Display of Quantitative Information 200 pages Envisioning Information 128 pages Visual Explanations 160 pages.
Do more with dates and times in R with lubridate 1.3.0. Note: This vignette is an updated version of the blog post first published at r-statistics Lubridate is an R package that makes it easier to work with dates and times.
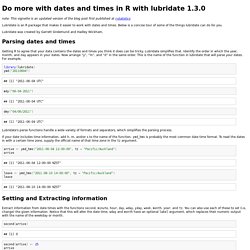
Below is a concise tour of some of the things lubridate can do for you. Do more with dates and times in R with lubridate 1.1.0. This is a guest post by Garrett Grolemund (mentored by Hadley Wickham) Lubridate is an R package that makes it easier to work with dates and times.
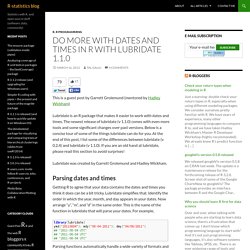
The newest release of lubridate (v 1.1.0) comes with even more tools and some significant changes over past versions. Below is a concise tour of some of the things lubridate can do for you. At the end of this post, I list some of the differences between lubridate (v 0.2.4) and lubridate (v 1.1.0). If you are an old hand at lubridate, please read this section to avoid surprises! Aylien — Text Analysis 101; A Basic Understanding for... Introduction The automatic classification of documents is an example of how Machine Learning (ML) and Natural Language Processing (NLP) can be leveraged to enable machines to better understand human language.

By classifying text, we are aiming to assign one or more classes or categories to a document or piece of text, making it easier to manage and sort the documents. Manually categorizing and grouping text sources can be extremely laborious and time-consuming, especially for publishers, news sites, blogs or anyone who deals with a lot of content. Broadly speaking, there are two classes of ML techniques: supervised and unsupervised. How to: Parallel Programming in R and Python [Video] Join (SQL) A programmer writes a JOIN statement to identify the records for joining.
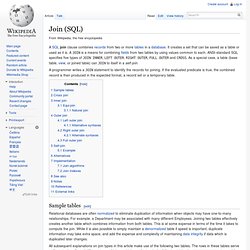
If the evaluated predicate is true, the combined record is then produced in the expected format, a record set or a temporary table. Relational databases are often normalized to eliminate duplication of information when objects may have one-to-many relationships. For example, a Department may be associated with many different Employees. Joining two tables effectively creates another table which combines information from both tables. Merging. Adding Columns To merge two data frames (datasets) horizontally, use the merge function.
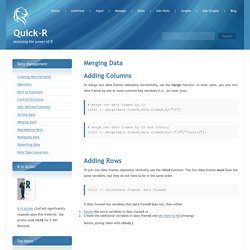
In most cases, you join two data frames by one or more common key variables (i.e., an inner join). # merge two data frames by ID total <- merge(data frameA,data frameB,by="ID") # merge two data frames by ID and Country total <- merge(data frameA,data frameB,by=c("ID","Country")) Adding Rows. Courses/03_GettingData/dplyr at master · DataScienceSpecialization/courses. A quick primer on split-apply-combine problems. I’ve just answered my hundred billionth question on Stack Overflow that goes something like I want to calculate some statistic for lots of different groups.
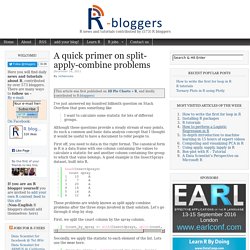
Although these questions provide a steady stream of easy points, its such a common and basic data analysis concept that I thought it would be useful to have a document to refer people to. First off, you need to data in the right format. The canonical form in R is a data frame with one column containing the values to calculate a statistic for and another column containing the group to which that value belongs. Reshaping Data in R. PLOS ONE: Cooperation between Referees and Authors Increases Peer Review Accuracy.
Abstract Peer review is fundamentally a cooperative process between scientists in a community who agree to review each other's work in an unbiased fashion.

Peer review is the foundation for decisions concerning publication in journals, awarding of grants, and academic promotion. Here we perform a laboratory study of open and closed peer review based on an online game. We show that when reviewer behavior was made public under open review, reviewers were rewarded for refereeing and formed significantly more cooperative interactions (13% increase in cooperation, P = 0.018). We also show that referees and authors who participated in cooperative interactions had an 11% higher reviewing accuracy rate (P = 0.016). Citation:Leek JT, Taub MA, Pineda FJ (2011) Cooperation between Referees and Authors Increases Peer Review Accuracy. Plyr tutorial. Quick-R: Built-in Functions. Almost everything in R is done through functions.
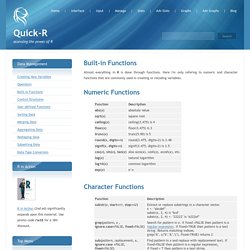
Here I'm only refering to numeric and character functions that are commonly used in creating or recoding variables. Numeric Functions Character Functions Statistical Probability Functions. Lecture%202.pdf. Синтаксис регулярных выражений регулярные выражения,perl,regexp,Delphi,Pascal,FreePascal,Kylix,Libraries,VCL,CLX,Tools,files utils. Регулярные выражения - это широкоиспользуемый способ описания шаблонов для поиска текста и проверки соответствия текста шаблону. Специальные метасимволы позволяют определять, например, что Вы ищете подстроку в начале входной строки или определенное число повторений подстроки. На первый взгляд регулярные выражения выглядят страшновато (ну хорошо, на второй - еще страшнее ;) ). Foreign.pdf. Rfoxfa/Getting_and_Cleaning_Data · GitHub. Is.R() Web Scraping. Rvest: easy web scraping with R rvest is new package that makes it easy to scrape (or harvest) data from html web pages, by libraries like beautiful soup.
It is designed to work with magrittr so that you can express complex operations as elegant pipelines composed of simple, easily understood pieces. Install it with: install.packages("rvest") rvest in action To see rvest Read more » Migrating Table-oriented Web Scraping Code to rvest w/XPath & CSS Selector Examples I was offline much of the day Tuesday and completely missed Hadley Wickham’s tweet about the new rvest package: Are you an #rstats user who misses python's beautiful soup? Read more » Web Scraping: working with APIs APIs present researchers with a diverse set of data sources through a standardised access mechanism: send a pasted together HTTP request, receive JSON or XML in return. Read more » Cran.r-project.org/web/packages/httr/httr.pdf.
Www.bioconductor.org/packages/release/bioc/vignettes/rhdf5/inst/doc/rhdf5.pdf. MySQL and R. Using MySQL with R is pretty easy, with RMySQL. Here are a few notes to keep me straight on a few things I always get snagged on. Typically, most folks are going to want to analyze data that’s already in a MySQL database. Being a little bass-ackwards, I often want to go the other way. One reason to do this is to do some analysis in R and make the results available dynamically in a web app, which necessitates writing data from R into a database. As of this writing, INSERT isn’t even mentioned in the RMySQL docs, sadly for me, but it works just fine. The docs are a bit clearer for RS-DBI, which is the standard R interface to relational databases and of which RMySQL is one implementation.
Opening and closing connections The best way to close DB connections, like you would do in a finally clause in Java, is to use on.exit, like this: RMySQL.pdf. Installing RMySQL under Windows. Update 2015-01-02: I slightly updated this tutorial based on the comments. Update 2014-12-16: This tutorial also works on Windows 8.1! Connecting R with MySQL can be somewhat difficult using Windows. The package RMySQL is not available as a precompiled zip-archive. It needs the installed libmysqll.dll library to be working and must therefore be compiled on your machine. Linux and Mac OSX have compilers build-in, Windows does not.
RMySQL < Main < Vanderbilt Biostatistics Wiki. R Study Group. Week 4. Contents References Dalgaard 2008 Wickham, H. 2009 ggplot2: Elegant graphics for data analysis Paradis, E. 2005 R for Beginners [PDF] R Graph Gallery Tufte, E. 2001 The Visual Display of Quantitative Information To install today install.packages("RColorBrewer") Base Graphics As Wickham points out in his book on his R graphics package, the R base graphics system has a pen on paper design. Plotting Basics The most basic command you can use to produce a plot is plot(). Plot Types. Big Data University. R:Литература — Psylab.info. R-library / source / bibs / ru-presents.bib — Bitbucket. R-library / source / bibs / ru-online.bib — Bitbucket. R-library / source / bibs / ru-books.bib — Bitbucket. R-library / source / bibs / ru-articles.bib — Bitbucket.
Human Activity Recognition Using Smartphones Data Set. Source: Jorge L. Reyes-Ortiz, Davide Anguita, Alessandro Ghio, Luca Oneto. Data Science, Wearable Computing and the Battle for the Throne as World's Top Sports Brand. Biostat-578/Advanced_data_manipulation.md at master · raphg/Biostat-578 · GitHub. R - what you can do with data.frame that you can't in data.table. R-Forge: data.table: SCM Repository. New package: jsonlite. A smart(er) JSON encoder/decoder. This week we released a new package on CRAN: jsonlite. This package is a fork of RJSONIO by Duncan Temple Lang and builds on the same parser, but uses a different mapping between R objects and JSON data. Cran.r-project.org/web/packages/XLConnect/vignettes/XLConnect.pdf. Installing some R packages – Allan Costa. I’m doing Coursera’s Specialization in Data Science and right now I’m in the third course of it, called Getting and Cleaning Data.
In order to answer this week quiz, I needed to install some R packages to load files in different formats. It took me some time to do it, so I’ll document my steps here for anyone that may have trouble doing it. How to install R, JGR and Deducer in Ubuntu. OpenBaltimore / City of Baltimore's Open Data Catalog. Baltimore. InfoGraphic: Migrating from SQL to MapReduce with MongoDB » rick osborne dot org.
GET blocks/list. Motivation and pre-requisites. OpenBaltimore / City of Baltimore's Open Data Catalog. Swirl: Learn R, in R. Материалы А. Шипунова. Swirldev/swirl_courses · GitHub. Installing swirl on Linux · swirldev/swirl Wiki · GitHub. Swirl and its dependencies require R version 3.0.2 or later as well as a recent version of libcurl. This page is our attempt to collect any information that might be helpful to Linux users wanting to install swirl.
Ubuntu and its derivatives These instructions have been successfully tested on: Материалы А. Шипунова. Programming R. Learn R. Must read books for Analysts (or people interested in Analytics) Our top 10 Data Science articles in 2014. 2014 has been a year of growth for us. We now get 10x traffic compared to what we used to get 12 months back. Statistics. A job board for people and companies looking to hire R users. R news and tutorials contributed by (563) R bloggers. DataTau.
Analytics, Data Mining, and Data Science. Simply Statistics. Язык программирования R. Материал из Викиучебника Добро пожаловать в учебник. Введение в R - систему статистического анализа данных. Высокие статистические технологии. R Installation and Administration. Introduction to R. Index of /~baldin/DataAnalysis/R. RSeek.org R-project Search Engine. Анализ и визуализация данных: Инсталляция R. Markdown Syntax Documentation. Denis Evsyukov. Markdown. Swirl: Learn R, in R. R Programming Help, How To's, and Examples. Как я покупал квартиру. Как я покупал квартиру. An R Introduction to Statistics. Correlation Coefficient. R news and tutorials contributed by (563) R bloggers. Quick-R: Home Page. Анализ данных при помощи Python. Графики в pandas и matplotlib.
Анализ данных. Coursera-rprog-assignment2/cachematrix.R at master · sefakilic/coursera-rprog-assignment2 · GitHub. R - Error in x$getinverse : $ operator is invalid for atomic vectors. Язык программирования R/Математика. Introduction to HDF5. Introduction to HDF5. R - Matrices and Lists. Анализ и визуализация данных: Полезные функции.