

Tools. Create and share visual ideas online. Vizualize.me: Visualize your resume in one click. 46 Tools To Make Infographics In The Classroom. Infographics are interesting–a mash of (hopefully) easily-consumed visuals (so, symbols, shapes, and images) and added relevant character-based data (so, numbers, words, and brief sentences).
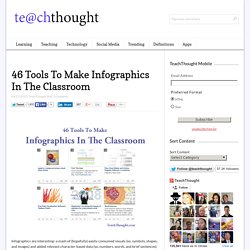
The learning application for them is clear, with many academic standards–including the Common Core standards–requiring teachers to use a variety of media forms, charts, and other data for both information reading as well as general fluency. It’s curious they haven’t really “caught on” in schools considering how well they bridge both the old-form textbook habit of cramming tons of information into a small space, while also neatly overlapping with the dynamic and digital world. So if you want to try to make infographics–or better yet have students make them–where do you start? The 46 tools below, curated by Faisal Khan, are a good place to start. 10 Tools for Creating Infographics and Visualizations. The author's posts are entirely his or her own (excluding the unlikely event of hypnosis) and may not always reflect the views of Moz.
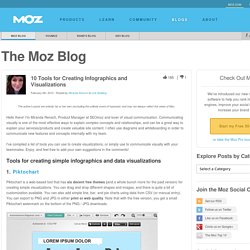
Hello there! I'm Miranda Rensch, Product Manager at SEOmoz and lover of visual communication. Communicating visually is one of the most effective ways to explain complex concepts and relationships, and can be a great way to explain your services/products and create valuable site content. I often use diagrams and whiteboarding in order to communicate new features and concepts internally with my team. I've compiled a list of tools you can use to create visualizations, or simply use to communicate visually with your teammates. Tools for creating simple infographics and data visualizations 1.
Piktochart is a web-based tool that has six decent free themes (and a whole bunch more for the paid version) for creating simple visualizations. 2. Easel.ly is another free web-based tool for creating infographics. 3. 4. 5. Catch all of your favorite videos! Download millions of videos to your PC, Cellphone, TV or IPOD from Internet and all the best video sites for free!
Download videos from social web sites like MySpace™, Dailymotion™, Metacafe™, Spike™, Yahoo! ™, Globo™, RTVE™, etc; thousands of video sharing sites! Glogster - Création de posters. Tagxedo - Creator. Processing ...
Personal $ Svg $20 ✓ Up to $75 merchandises for personal use. D3.js - Data-Driven Documents. Honest Buildings, a Sort of Yelp and Linkedin for Architecture, Launches today. Honest Buildings/Screen capture How do you know if a building is really green?

If you are a prospective tenant looking for space, an employee looking for a healthy environment, or you are just interested in architecture and design, where do you go? How do you find out what people think of the places they work? As of today, you can go to Honest Buildings, a startup that lets you "See what's happening inside buildings and connect with people who live, work and spend time there.
" Founder Riggs Kubiak described it in Forbes: Online reviews have already transformed many industries. Honest buildings/Screen capture Data on 50,000 buildings containing over 10 billion square feet have already been listed on the site, although there is not much to be gleaned other than the basics at this point; I checked out Discovery Headquarters above and there are the basics about it being LEED Platinum; the site is brand new and there are not a lot of reviews and comments yet.
Tutorial: Using Templates to Create Content in Google Earth. Creating Compelling Google Earth Description Balloons « GeoChalkboard. Posted on May 22, 2008.
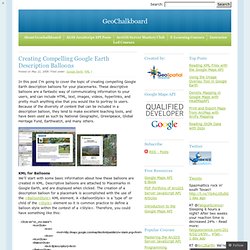
Filed under: Google Earth, KML | In this post I’m going to cover the topic of creating compelling Google Earth description balloons for your placemarks. Earth Outreach. The spreadsheet-to-KML tool featured in the Spreadsheet Mapper 2.0 tutorial allows you to use six ready-made balloon designs.
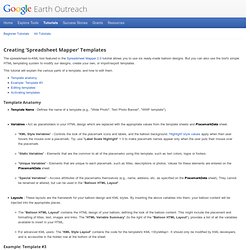
But you can also use the tool's simple HTML templating system to modify our designs, create your own, or import/export templates. This tutorial will explain the various parts of a template, and how to edit them. Template Anatomy Template Name - Defines the name of a template (e.g., "Wide Photo", Text Photo Banner", "WWF template"). Variables - Act as placeholders in your HTML design which are replaced with the appropriate values from the template sheets and PlacemarkData sheet. Blogger for Dummies. ActionScript® Toolbox. Basic tutorials - Google Fusion Tables Help. Create with Fusion Tables These tutorials step you through using Fusion Tables’ features to accomplish neat things with your data.
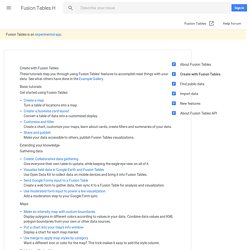
See what others have done in the Example Gallery. Basic tutorials Get started using Fusion Tables: Create a map Turn a table of locations into a map. Extending your knowledge Gathering data Create: Collaborative data gathering Give everyone their own table to update, while keeping the eagle-eye view on all of it. Maps Make an intensity map with custom boundaries Display polygons in different colors according to values in your data. Publishing / Embedding Embed visualizations in Google Sites Work around the JavaScript restrictions in Google Sites Merge tricks.