
20 apps to help you keep your New Year resolutions. 18 Helpful Tools for Better Gmail Experience. Gmail (also known as Google Mail) is one of the top email services that seem to get better with time.
Gmail already comes with a set of great features itself, but there are numerous other tools out there, namely Chrome extensions and Firefox add-ons, that allow you to extend and enhance its functionality. (Image Source: opacity) While many of the tools seem to accomplish the same task, there are quite a few unique extensions and add-ons that once you start using them, it’s hard to live without them. So let’s take a look at some of the most useful and helpful tools currently available for Gmail service, and make your Gmail experience better than ever!
Related: Gmail Advanced Search – Ultimate Guide Chrome Extensions Send from Gmail The genuine benefit of having Send from Gmail is that any time you click on an email address on any web page, it will automatically open a Mail Compose window in Gmail – right within your browser. 18 Gmail Productivity Plugins. The right plugin can transform Gmail from a standard email program into a productivity powerhouse, capable of managing your communications and professional networks.
Here is a list of productivity plugins for Gmail. There are plugins to schedule emails, track correspondence, manage social networks, and more. Over 100 Incredible Infographic Tools and Resources (Categorized) This post is #6 in DailyTekk’s famous Top 100 series which explores the best startups, gadgets, apps, websites and services in a given category.

Total items listed: 112. Tag Archive. Create simulations online with ease. Free Data Visualization and Analysis Tools. What it does: Google Refine can be described as a spreadsheet on steroids for taking a first look at both text and numerical data.
Like Excel, it can import and export data in a number of formats including tab- and comma-separate text files and Excel, XML and JSON files. Refine features several built-in algorithms that find text items that are spelled differently but actually should be grouped together. After importing your data, you simply select edit cells --> cluster and edit and select which algorithm you want to use.
After Refine runs, you decide whether to accept or reject each suggestion. For example, you could say yes to combining Microsoft and Microsoft Corp., but no to combining Coach Inc. with CQG Inc. Data Visualization: 20+ Useful Tools and Resources. There are plenty of cool technologies available to collect and examine data.
Both web and desktop applications have provided some really great interfaces to fall in love with data mining, and with the rise in popularity we have noticed an increased number of infographics created over the past few years. Today we’ll be looking into some really cool and popular online resources for data visualization. The Best Tools for Visualization. Visualization is a technique to graphically represent sets of data.
When data is large or abstract, visualization can help make the data easier to read or understand. There are visualization tools for search, music, networks, online communities, and almost anything else you can think of. Whether you want a desktop application or a web-based tool, there are many specific tools are available on the web that let you visualize all kinds of data. Here are some of the best: Visualize Social Networks Last.Forward: Thanks to Last.fm's new widget gallery, you can now explore a wide selection of extras to extend your Last.fm experience. Last Forward Friends Sociomap: Friends Sociomap is another Last.fm tools that generates a map of the music compatibility between you and your Last.fm friends. Fidg't:Fidg't is a desktop application that gives you a way to view your networks tagging habits. Infographics and other tools of news visualization. Jingfei’s main Tasks - Asana. 13 web apps you need to start 2013 off right. 29 December '12, 05:00pm Follow Whenever we start a new year, we really want to focus on the “new” part.
Wherever we can get a “clean slate”, we try. When it comes to our technology, that may mean cleaning out our files and folders, reviewing our native applications and deleting those going unused, or simply (and finally) getting to that elusive “inbox zero”. 20 best web apps you've never heard of. Gmail, Twitter, Facebook, Flickr - a few giants so dominate the web app world that it's hard for anyone else to make an impression.
We've spent some time looking beyond the leading sites, though, and discovered a host of interesting tech startups. Some take existing web app ideas and add a new spin of their own. Others are more innovative, using fresh concepts to deliver powerful new ways of using the web. But they're all worthy of your attention - and here are 20 of the best. 1. Big business has long understood the value of powerful and efficient collaboration tools - and now TeamLab is making them available to everyone. The service is perfect for small businesses, clubs, or any group of people who need to work together online. 2. Roc is a free online music creator that's entirely browser-based, point and click - no musical ability required. Ideas, issues, knowledge, data - visualized! Visualizing.org. With mobile tech, mapping a city’s emotions, memories. PHILADELPHIA -- What can technologies do for us to help us understand what's going on in the city?
University of Pennsylvania urban planning professor Amy Hillier took to the stage here at the second annual TEDxPhilly conference on Tuesday to demonstrate how technology could one day help us look beyond statistics to visualize the very experience of a city. "Could we map emotion? Memory? Joy? Emotion? Today's geographic information system, or GIS, technology allows us to map the visible city -- streets, sidewalks, buildings -- that we see when we walk around. "Once upon a time, this was magnificent," Hillier said. But what does the city look like beneath the surface? "The city I'm interested in is the city we don't see," Hillier said. But the third step, arguably the most important, is the one that no one can see but everyone can feel: the societal impact of those other layers.
Visualizing.org. 40+ Visualization Tools for dashboards and social business. There is so much data that it is an incredible task to actually comprehend it.
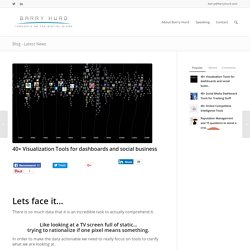
Like looking at a TV screen full of static… trying to rationalize if one pixel means something.