
Podcasts and Downloads - More or Less: Behind the Stats. How to Lie with Statistics : Darrell Huff. El mapa del “Feliz año Nuevo” en Twitter. Un mar de datos. El Departamento de Matemática aplicada y Estadística de la UPCT ha clausurado 2013, el Año Internacional de la Estadística con una conferencia de un miembro de la estructura de dirección del Instituto Nacional de la Estadística.
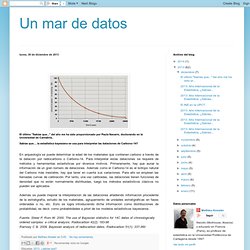
Miguel Angel Martínez Vidal, subdirector general de estadísticas de población. Impartió el lunes 16 de diciembre una charla estupenda que nos ayudó a evaluar correctamente la importancia y las dificultades, para un país como el nuestro, de producir indicadores fiables.
Cuatro herramientas para facilitarte el trabajo en equipo. Portal:Statistics. Anscombe's quartet. All four sets are identical when examined using simple summary statistics, but vary considerably when graphed Anscombe's quartet comprises four datasets that have nearly identical simple statistical properties, yet appear very different when graphed.
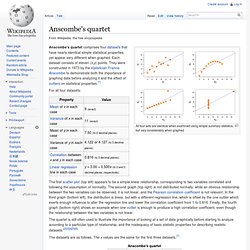
Each dataset consists of eleven (x,y) points. They were constructed in 1973 by the statistician Francis Anscombe to demonstrate both the importance of graphing data before analyzing it and the effect of outliers on statistical properties.[1] For all four datasets: The first scatter plot (top left) appears to be a simple linear relationship, corresponding to two variables correlated and following the assumption of normality.