
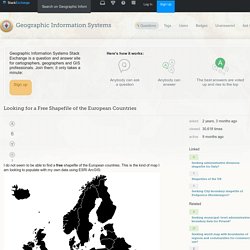
Tidy spatial data analysis. R to D3 rendering tools. Simple Spatial Modeling – Part 2: Exercises. Simple Spatial Modeling – Part 1: Exercises. Glossary:Country codes - Statistics Explained. Data - Looking for a Free Shapefile of the European Countries. A GRASS-GIS way: get the NUTS 2013 ESRI Shapefile wget unzip unzip NUTS_2013_01M_SH.zip and, if not existing, create a Location based on EPSG 3035.
Unités administratives / Unités statistiques - Eurostat. NUTS - Eurostat. Background - Eurostat. Geodata - Eurostat. All datasets are provided with their metadata in XML format.
Geographic information system (GIS) software is needed to process the downloaded geodata. Geographical datasets are provided in two formats: Shapefile and ‘Personal File Geodatabase’. Shapefiles have a limitation in the attribute name length. For this reason, the attribute name might be truncated when compared with the name in the metadata or in the personal file geodatabase. The European Commission maintains this dataset to improve public access to information about its initiatives and EU policies in general. GADM. Color Palettes. UseR! International R User 2017 Conference. UseR! International R User 2017 Conference. UseR! International R User 2017 Conference. UseR! International R User 2017 Conference. UseR!2017. Section 12: Spatial data. As I mentioned above, today we are focusing on a class of data, rather than a specific set of econometric techniques.
The reason for this change is manyfold. Spatial data are increasingly important within research—economics, environmental studies, development, agriculture, political science all are increasingly utilizing spatial variation. Spatial variation is important in many data-generating processes (e.g., the effects of air pollution), and it also can provide some compelling natural experiments (e.g., the rollout of a new policy throughout a country). Furthermore, some topics simply cannot be analyzed well without analyzing the topic in space, e.g., air pollution, gerrymandering, segregation, or well depletion.Spatial data are fairly distinct from other types of data in their structure. These structural differences tend to require unique techniques for compiling, describing, and analyzing the data.
UseR! International R User 2017 Conference. The annual useR!

Conference is the main meeting of the international R user and developer community. Its program consists of both invited and user-contributed presentations. The invited keynote lectures cover a broad spectrum of topics ranging from technical and R-related computing issues to general statistical topics of current interest. The user-contributed presentations and posters are submitted as abstracts prior to the conference and may be related to (virtually) any R-related topic. The presentations are typically organized in sessions of either broad or special interest, which also comprise a "free" discussion format. This year the conference will be held at the Wild Gallery in Brussels, Belgium. The program will cover topics such as. Material de los Talleres de Geoestadística realizados con R y gvSIG en Valencia y Culiacán.
Population grids - Statistics Explained. This article introduces population grid statistics as an alternative to population statistics for administrative areas.
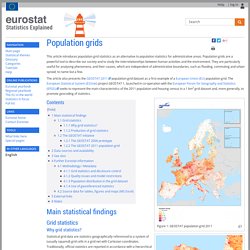
Population grids are a powerful tool to describe our society and to study the interrelationships between human activities and the environment. They are particularly useful for analysing phenomena, and their causes, which are independent of administrative boundaries, such as flooding, commuting and urban sprawl, to name but a few. GitHub - NoahZinsmeister/Rbnb: Experimental R front-end for the Airbnb API.
Blog IDEE: Cartociudad a descarga gratuita. Section and Murcia census district cartociudad project - Conjuntos de datos - European Data Portal. 30027. Censo electoral por mesas (Elecciones Generales 2016) - Ayuntamiento de Molina de Segura - Datos Abiertos en la Región de Murcia. Get Colors from Image. With the magic of HTML5 you can get colors from any image with this simple online tool.

To use this new color tool it's recomended that you upgrade your web browser to the latest version. (For the full HTML5 support). Step 1: Select image from your computer and click "Show image" button. Scaled version of the image will show up. Step 2: Click anywhere on the image to choose an area. 9x9 pixels will be magnified in a small box. Step 3: Click anywhere in the small box to select desired color. Step 4: Click again on the image to choose another 9x9 pixels area. Creating color palettes in R. There are several color palettes available in R such as rainbow(), heat.colors(), terrain.colors(), and topo.colors().
We can visualize these as 3D pie charts using the plotrix R package. Other popular color palettes include the RColorBrewer package that has a variety of sequential, divergent and qualitative palettes and the wesanderson package that has color palettes derived from his films. You can also create your own color palettes in R with your colors of choice with the colors() function or creating a vector with the color names.
Demografía y población /Padrón. Población por municipios /Relación de municipios y sus códigos por provincias / Últimos datos. Rcolor. Logged Out - CDRC Data. Hacia un futuro de estadísticas georreferenciadas: la importancia del 'dónde' Fundación Universidad-Empresa, Adeit Plaza Virgen de la Paz, 3 46001 Valencia Valencia, 4 de mayo de 2017 Entrada libre.

Plazas limitadas Por favor, confirme su asistencia rellenando el siguiente formulario Objetivos Cuando en el siglo XIX se creó el Instituto Geográfico y Estadístico la información geográfica y estadística estaban indisolublemente unidas y, en cierta forma, una no se concebía sin la otra puesto que, al final, la práctica totalidad de las estadísticas tienen una base territorial, y por tanto geográfica. Aspectos geográficos de la estadística: Del Censo 2011 a las infraestructuras de datos espaciales. Centro de Descargas del CNIG (IGN) Descripción: Base Topográfica Nacional a escala 1:100.000.
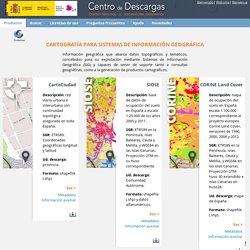
Portal de la Dirección General del Catastro. Datos literales sobre los bienes inmuebles rústicos o urbanos: titularidad, suelo, construcción, valor catastral, usos, etc.
Centroides de los Municipios - ETRS89 UTM 30N. Municipios - ETRS89 UTM 30N. Límites de Municipios (IGN) Data - Eurostat. Administrative Units / Statistical Units - Eurostat. Callejero Móvil. Geoportal. Portada. Datos estadísticos - Portal de datos abiertos del Ayuntamiento de Madrid. Geoportal. Applied Spatial Data Science with R. Introduction I recently started working on my Ph.D dissertation which utilizes a vast amount of different spatial data types. During the process, I discovered that there were a lot of concepts about using R for spatial data analysis that I was not aware of.
The purpose of this report is to document some of those concepts and my favorite packages for spatial data analysis. Making Maps With R · Reproducible Research. Intro For a long time, R has had a relatively simple mechanism, via the maps package, for making simple outlines of maps and plotting lat-long points and paths on them. More recently, with the advent of packages like sp, rgdal, and rgeos, R has been acquiring much of the functionality of traditional GIS packages (like ArcGIS, etc). This is an exciting development, but not always easily accessible for the beginner, as it requires installation of specialized external libraries (that may, on some platforms, not be straightforward) and considerable familiarity with GIS concepts. More recently, a third approach to convenient mapping, using ggmap has been developed that allows the tiling of detailed base maps from Google Earth or Open Street Maps, upon which spatial data may be plotted.
Plotting World and Country maps in R. UPDATE: there's now an additional guide to plotting maps in R that uses different data available on the GADM website. What If You Dig A Hole Through The Earth? Library(xlsx) library(ggmap) library(mapdata) Mapas con R. Ejemplo de un Mapa de las áreas sanitarias de Asturias. Maps in R: choropleth maps - MilanoR. This is the third article of the Maps in R series. After having shown how to draw a map without placing data on it and how to plot point data on a map, in this installment the creation of a choropleth map will be presented.
A choropleth map is a thematic map featuring regions colored or shaded according to the value assumed by the variable of interest in that particular region. Packages used. MAPS WITH R. A package that provides classes and methods for spatial data (points, lines, polygons, grids). The classes document where the spatial location information resides, for 2D or 3D data.It does not contains gegrafical data to plot maps directly (as the library maps did), but the methods and classes for plot data provided by other sources.Here is the sp package documentation.
First, the sp library should be downloaded and loaded. if (! "sp" %in% installed.packages()) install.packages("sp")library("sp") This time, we will use the spatial data provided by GADM, a free spatial database of the location of the world's administrative areas (or administrative boundaries). Latitude and Longitude Finder on Map Get Coordinates. GitHub - GeoinquietosMadrid/datavis-with-r: Materiales para el taller de Programación GIS II: Visualización de datos con R.