
How to Use Visme’s New Pictograph Maker to Visualize Statistics. Statistics visualized with icons and other graphic elements have a unique way of turning otherwise hard-to-process information into bite-sized, engaging figures.

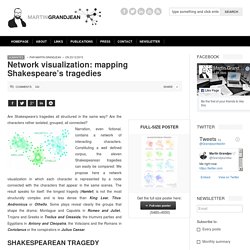
But not everyone has the time or resources to create these from scratch using traditional graphic design software. This is why Visme recently launched a cool pictograph maker that allows you to translate statistics such as “8 out of 10 people only read headlines” into visual representations and even create bar charts using icons. Blogopole.fr. Xkcd. Network visualization: mapping Shakespeare's tragedies. Are Shakespeare’s tragedies all structured in the same way?

Are the characters rather isolated, grouped, all connected? Narration, even fictional, contains a network of interacting characters. Constituting a well defined corpus, the eleven Shakespearean tragedies can easily be compared: We propose here a network visualization in which each character is represented by a node connected with the characters that appear in the same scenes. A visual exploration on mapping complex networks. Alfbarr-v.2 copy.jpg (JPEG Image, 3600 × 1421 pixels) - Scaled (28%)
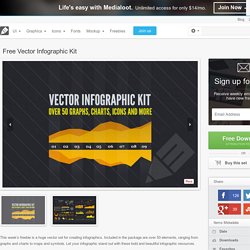
Rockgenres-v2 copy.jpg (JPEG Image, 3000 × 2055 pixels) - Scaled (34%) Data Addict. Free Vector Infographic Kit. This week’s freebie is a huge vector set for creating infographics.

Included in the package are over 50 elements, ranging from graphs and charts to maps and symbols. Let your infographic stand out with these bold and beautiful infographic resources. In the download the filetypes are AI, EPS and SVG so you can use this kit at any scale, easily edit the color scheme, and the data points. In a recent interview, Jeffrey Katzenberg described his first day at Disney as the newly appointed head of The Walt Disney Studios.

The equally new Disney CEO, Michael Eisner, gave him a simple, unambiguous mandate: fix animation at Disney. Although a veteran in the film business, Katzenberg had no experience with animation and little appetite for it. Disney long-timers, however, informed him that Walt Disney had left extensive notes and audio recordings concerning his experiences making animation, which were stored in the Disney archives. Looking through these records, he discovered that Walt had effectively “left the recipe for making a Disney animated movie.” Katzenberg proceeded to apply this recipe with remarkable success, adding on the way some extra ingredients of his own. Algorithm-generated song, based on income data. Seconde Guerre Mondiale : un bilan humain - un documentaire chiffré sur la guerre et la paix. Music Timeline. Templates - Venngage.
What’s a mind map and how can I make it fully interactive? It’s great to see you again!

Today we’d like to talk about mind maps, explain why they’re so useful and give you some tips to create them correctly. First things firts: what’s a mind map? It could be explained as “a technique used to depict knowledge graphically. A conceptual map is a net of concepts. WHY DO WE LIKE INFOGRAPHICS SO MUCH ? by Genially on Genially.